Galena Land Use Control
Disclaimer: The Galena Airport land use control Webmap depicts known areas of contamination in Galena, Alaska. The location information is the best available approximation of known contamination at Galena, but does not confirm or deny the possibility that additional areas of contamination may be identified. The data is to be used for the purpose of referencing known contamination. This map was developed using the best available information and has undergone several iterations of quality control. Therefore, the map is an accurate depiction of the data used to create it, but may still differ from the actual site conditions.
This web page explains how to use the Galena Land Use Control (LUC) web map. The Alaska Department of Environmental Conservation (DEC) notification form, required for any work in a Galena contaminated site, is located here as well. Acronyms and abbreviations used in the web map are defined in the SPAR glossary, which is linked below.
How to Use This Web Map
Introduction
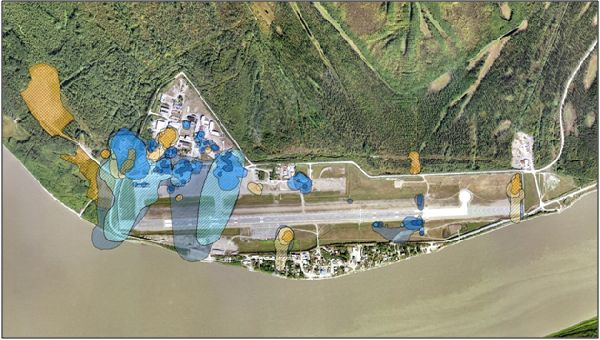
The Galena Land Use Control (LUC) web map is an interactive map, hosted and created by the Alaska Department of Environmental Conservation (DEC). The map displays the boundaries of soil and groundwater contamination in and around the Former Galena Air Force Base located in Galena, Alaska.
This map was created to better inform contractors and the general public of contamination types, contamination boundaries, and the regulatory requirements for construction and excavation activities at these sites.
Using this map, contractors may determine if they need to develop work plans that include the necessary worker protection, soil screening techniques, stockpiling and contamination disposal procedures required by state and/or federal regulations.
Map Components
Contamination Colors
There are several different, general types of contamination displayed visually on this map:
Landfills and sites with CERCLA contaminants are orange and all other sites are blue.
Sites regulated under both the Comprehensive Environmental Response, Compensation, and Liability Act (CERCLA) and DEC have specific requirements for stockpiling and disposal. Additionally, the requirements for worker protection may be different in these sites.
Other sites are regulated solely by DEC regulations and are generally related to fuel spills. There are different requirements for stockpiling and disposal than at CERCLA regulated sites.
Contamination Types
The contamination types on the web map are split in to three different levels, based on the concentration of contamination and whether it is found in the soil or the groundwater. All of these contamination types require an DEC approved work plan prior to construction activities.
Surface Soil Contamination
- This contamination is present in the soil between 0 and 7 feet below ground.
- The contamination exceeds levels that DEC deems safe for direct contact to the skin, inhalation, ingestion or migration to groundwater.
- Former Landfills are also included in this color scheme
- If your project is within 0 to 7 feet of the surface then you can turn off all other map layers
Migration to Groundwater Contamination
- This contamination may be present at any depth
- The contamination is in concentrations above the levels DEC deems safe for migration to groundwater, and below 15 feet the contamination may be above direct contact, ingestion, and inhalation levels.
Groundwater Contamination
- This contamination is present in the groundwater and could be present at any depth.
- The contamination in the groundwater makes it unsuitable for drinking.
Buffers
Each contamination type has been buffered from its original boundaries. The contaminated areas represented on this web map were originally presented to DEC in reports as shapes around individual sampling points. After reviewing the data presented in these reports, DEC employees would either approve or modify the shapes presented. Once the shapes sufficiently matched the sampling data presented in the reports, the shapes were approved by DEC and could be integrated into the map.
DEC and the Air Force agreed that standard buffers should also be added to the areas of contamination shapes to ensure that their boundaries remained protective in case of missing data or contaminant migration.
However, there is often uncertainty involved when developing contamination shapes. Where there is missing data, the contamination shape was given a dotted line, rather than a solid one. It was decided that a larger buffer would be added to areas where the contamination shape was dotted.
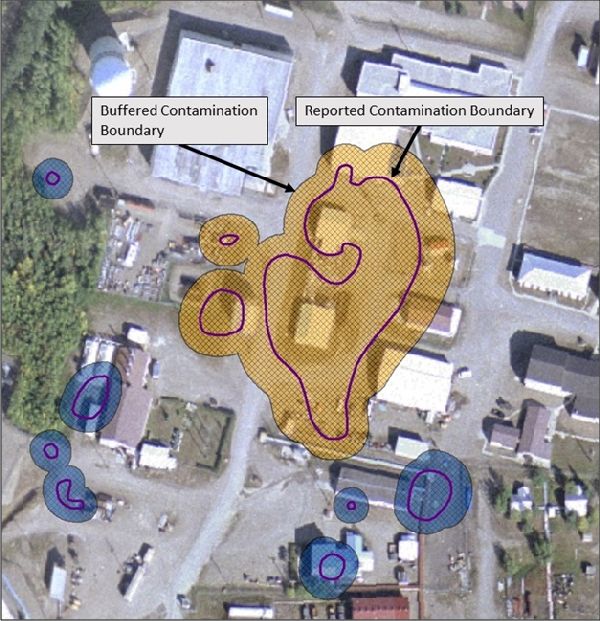
There is a 30 foot buffer around sites which contain CERCLA-regulated contaminants. An extra 20 feet has been added to areas where there is uncertainty at contamination boundaries.
Additionally, there is a 20 foot buffer around DEC-regulated sites. An extra 10 feet has been added to areas where there is uncertainty at contamination boundaries.
Metadata
Metadata has been added to each layer on the web map, and was recorded for each site as it was developed. Although they are not available as a part of the web map, individual site metadata records are held by DEC and may be accessed by interested parties. Contact DEC for more information.
Interacting with the Map
Navigating the Map
To move around the map, you may use your keyboard’s arrow keys or you may click and “drag” with your mouse. You may zoom in and out on the map with your mouse scroll wheel, or you can click the “+” and “-“ icons on the map.
Map Layers
This web map is composed of several “layers” which can be turned on and off using the menu on the left side of the screen. The layers are stacked in the order that they appear in the menu under the “content” tab. The “content” tab will be similar to what is displayed below:
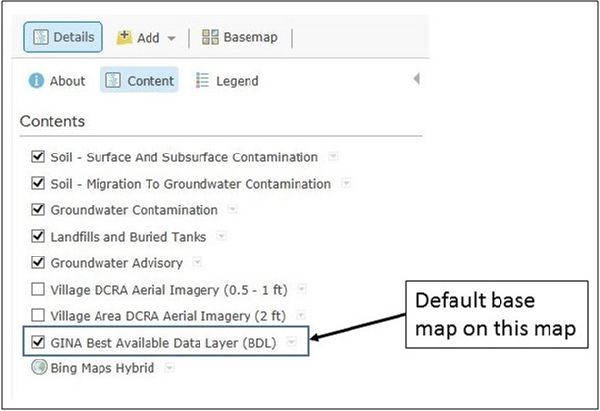
Please note that the Content tab may appear differently in the current version of the web map.
Base Map
Typically, the base map is at the bottom of the stack in the “content” tab. The base maps for this web map are pictures of the Galena Airport from above. The Galena LUC Web Map provides several base maps (different versions of the pictures of Galena Airport). They are all slightly different, so it can be useful to try several base maps.
The default base map box should be “checked,” displaying the default base map automatically.
Contaminated Areas
The layers which display contamination at the Galena Airport are divided by contamination type. The contaminated areas layers are stacked in the “content” menu and on the map so that contamination closer to the surface will be displayed on top. Each of the contamination types can be turned on and off individually. Contamination types at CERCLA sites are displayed preferentially over DEC sites.
Transparency
To better view the base map or a lower level layer when the contamination types are displayed, the layer transparency may be adjusted. To adjust transparency, navigate to the “content” tab in the menu on the left side of the screen and click on the upside down triangle to the right of the layer you wish to adjust. Once clicked, the triangle will display a drop-down menu which will include the transparency option. Click on transparency and a slider menu will pop up to the right of the transparency option. This slider can be adjusted from 0 to 100% transparency to better display the layers below.
Clickable Areas
Once it has been displayed on the web map, each contamination type and level is “clickable”.
If you click on a contaminated area, a box will pop up, as displayed below:
(Please note that the pop up box will obscure the contaminated area below it unless you click near the shape’s “edge”)
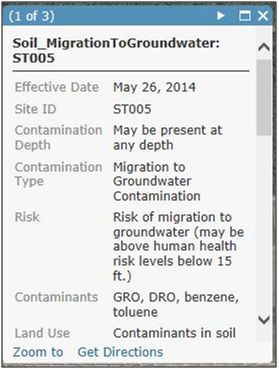
Please note that the popup box may appear differently in the current version of the web map.
As you can see, there are many pieces of information included in the pop-up boxes. Not all of the information for a site contamination type can fit in this view. To expand the box to see all of the information click the “box” icon in the upper right corner.
There are several important pieces of data displayed in the expanded popup box.
First, the Effective Date of the site will be displayed. This date refers to the first time this site was uploaded to the Galena LUC Web Map. The Updated field, if it is displayed, states the most recent time the site information was updated. The contamination type is then clearly stated in the Contamination Type field, followed by the Risks associated with the contamination type. Next is the Contamination Depth. The Site ID and DEC File Number in the contaminated site database follows.
Next, the Regulatory Program field states which regulations apply to this site. The regulatory program is important for determining the screening techniques, worker protections, and contaminant stockpile and disposal requirements at the site.
The most important Contaminants of concern at the site are listed next, followed by the Land Use Control (LUC). The Land Use Controls are perhaps the most important information for Work Plan development. For each contaminant level, it is stated what the requirements are at this site.
Further information for each site is provided in the Land Use Control Document (.pdf format), which is provided in a link. This PDF document can be downloaded and referenced in the field or attached to a work plan and/or the Galena Planned Work Notification Form (on page link).
The Information Source field lists the source used to develop the site’s buffered contamination boundaries. The figure used to develop the site contamination boundaries is included in the applicable LUC document.
The Site Description field provides a link to the site entry on the DEC contaminated sites (CS) database. The database entry includes a site description and a history of actions taken at the site.
To continue, we will explain how to navigate between overlapping contamination levels.
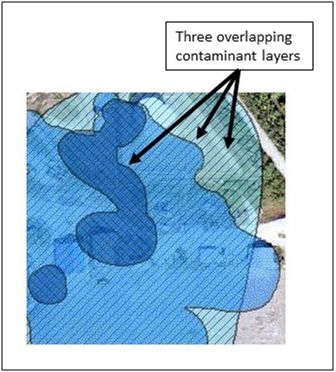
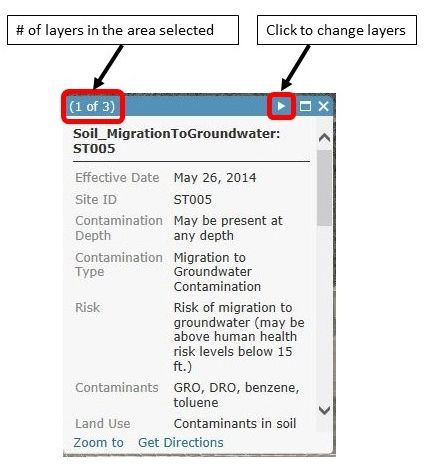
The screenshot above illustrates an area where three contaminant layers overlap.
As you can see here, contamination levels at each site often overlap. When this occurs, the popup box has the capability to switch between levels. The top left corner of the popup box will tell you if there are additional contamination levels below the one you’ve clicked on, as it will display (1 of 2) or (1 of 3) or (1 of 4), as shown below. Click on the “arrow” at the top right of the popup box to navigate between levels. The layer level can be changed whether the popup box has been expanded or when it is still reduced, as pictured below.
Please note that the popup box may appear differently in the current version of the web map.
Galena Planned Work Notification
If you have discovered that you are planning construction in an area that is contaminated, you are required to contact DEC prior to construction. Please fill out the Fillable Form for Planned Work at a Contaminated Site in Galena (PDF) and submit it to DEC. You may attach your work plan to this form for DEC approval or you may send the form first and submit the work plan at a later date. Also attach any LUC document(s) that apply to your work plan to the notification form. Please note that both CERCLA and DEC regulated sites require an DEC approved work plan prior to any construction activities.
Frequently Anticipated Questions
Data Set Scope
- What does this data set describe?
- This interactive map was designed to display the boundaries of contamination at the known contaminated sites at the Galena Airport. The map offers zoom and scroll options and displays multiple levels and types of contamination.
- What geographic area does this data set cover?
- The data set covers the former Galena Air Force Base at Galena, Alaska, and small sections of the surrounding area.
- Does the data set describe conditions during a particular time period?
- The data set used to develop the current contamination boundaries was collected over several years (2009-2014) at various times of year. Most of the sampling has occurred during the warmer summer months. Groundwater sampling has been conducted at the Galena Airport during yearly low and high groundwater elevations. The contamination boundaries have been developed to show the maximum extent of contamination indicated from all sample events.
- Does this map cover every contaminated site in Galena?
- No, it just covers the contaminated sites related to Air Force operations in and around the Former Galena Air Force Base.
- Who do I contact if I have questions about this map?
- For questions about this map, contact the DEC Contaminated Sites Program
Data Creation Methods
- Who produced the data set?
- Several contractors working for the U.S. Air Force at the Galena Airport prodced the data set used to determine contamination boundaries. The data was collected, verified, and validated in accordance with an DEC approved Work Plan. All data sets were reviewed by the US Air Force and DEC for acceptability and usability.
- From what previous works were the data drawn?
- The data used to create this map were drawn from DEC-approved reports submitted by the Air Force. These reports were finalized in 2013 and have integrated all of the known analytical sampling that has occurred in each area addressed.
- How were the data modified?
- Polygons were drawn around the sampling points which contained contamination concentrations above the screening levels applicable to that site. The polygons were split into sections symbolizing uncertainty or confidence in the contamination boundaries. These polygons were then further buffered to develop the polygons representing land use control areas, with larger buffer at the areas of uncertainty.
Data Set Reliability and Problems
- How well have the measurements been checked?
- The measurements used to generate the shapes displayed in this document have been subject to laboratory quality control evaluations and other quality assurance reviews approved through the controls recorded in DEC regulations.
- Where are the gaps in the data? What is missing?
- There are uncertainties in the contaminant boundaries at multiple sites. These areas have been given larger buffers but this does not guarantee that the contamination is fully enveloped by the land use control areas until more data is collected. The data is to be used for the purpose of referencing known contamination only.
Obtaining and Use of Data Set
- How can someone get a copy of the data set?
- The data set can be downloaded for personal/home use. To get a copy of the data used to generate the site boundaries, please contact DEC.
- Are there legal restrictions on access or use of the data?
- This data is to be used for the purposes of planning activities in and around the Galena Airport.
- Who distributes the data?
- This data is distributed and hosted by DEC.
- What is the number I should use to refer to specific data sets?
- The Air Force Site Designations (“Site ID”) and the DEC file number, together, would be the best combination of data to provide to DEC personnel.
- What legal disclaimers am I supposed to read?
- Please read the legal disclaimer at the top of this page.
- Who wrote the metadata?
- The metadata was developed by DEC employees during map creation. It was filled out by Shannon & Wilson contractors.
 Indicates an external site.