2011-2014 Soldotna Site Monitoring Report
Particulate Matter Monitoring from 2011 to 2014
List of Figures
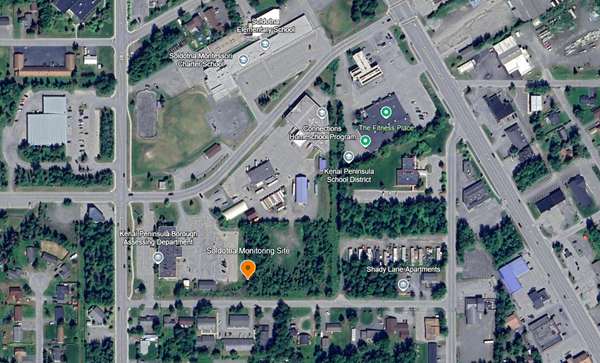
Figure 1 Satellite image from Google Earth of the Soldotna site
Figure 2 Soldotna monitoring site
Figure 3 Population estimates for Soldotna
Figure 4 Daily PM10 (µg/m3 ) from 2012-2014
Figure 5 Daily PM2.5 (µg/m3 ) from 2011-2014
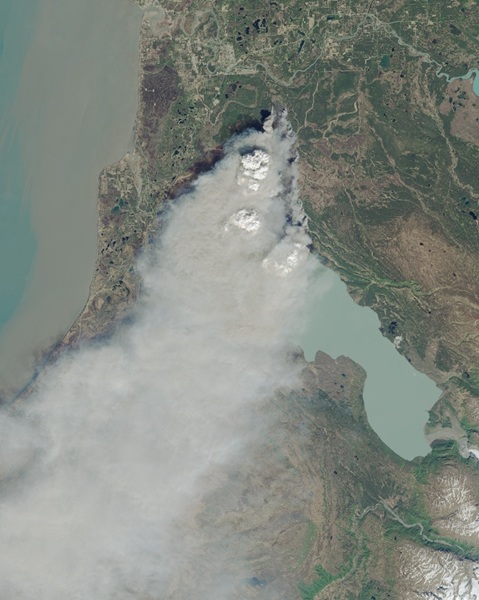
Figure 6 Satellite image of 2014 Funny River Fire from May 20, 2014
List of Tables
Table 1 PM monitoring method codes, type, and instruments
Table 2 First and second maximum PM10 (µg/m3 ) values
Table 3 List of all days that exceeded the 24-hour PM2.5 NAAQS in Soldotna
Table 4 PM2.5 (µg/m3 ) design values
Table 5 First and second maximum PM2.5 (µg/m3 ) values
Acronyms
AQS Air Quality System
BAM Beta Attenuation Monitor
CIRIAMS Cook Inlet Regional Integrated Air Monitoring System
DEC Alaska Department of Environmental Conservation
EPA U.S. Environmental Protection Agency
FEM Federal Equivalent Method
µg/m3 micrograms per cubic meter
Mat-Su Valley Matanuska-Susitna Valley
NAAQS National Ambient Air Quality Standard
PM2.5 Particulate matter less than 2.5 microns
PM10 Particulate matter less than 10 microns
POC parameter occurrence code
QA quality assurance
SPM Special purpose monitoring
VSCC very sharp cut cyclone
Executive Summary
The State of Alaska Department of Environmental Conservation (DEC), in an effort to protect the public health and the environment, has been mandated by the legislature to evaluate, assess, and mediate environmental issues that may affect the health and welfare of residents within the state. To further these objectives, DEC has established a statewide air monitoring network. The network currently consists of sites in Juneau, Anchorage, Fairbanks, and the Matanuska-Susitna Valley (Mat-Su Valley). This report provides information about air monitoring in Soldotna, Alaska from 2011 to 2014.
Between 2011 and 2014, DEC monitored particulate matter at the Soldotna monitoring site. Two sizes of particulate matter, particulate matter with an aerodynamic diameter of 10 micrometers or smaller (PM10), and particulate matter with an aerodynamic diameter of 2.5 micrometers or smaller (PM2.5) were monitored at the site. The U.S. Environmental Protection Agency (EPA) sets National Ambient Air Quality Standards (NAAQS) for each of these pollutants.
The Soldotna monitoring site was established as part of the Cook Inlet Regional Integrated Air Monitoring System (CIRIAMS) monitoring network to provide real-time data to the public and help DEC issue more timely air quality advisories. Due to budget issues the site was discontinued in July 2014. No regulatory grade monitoring currently occurs on the Kenai Peninsula, but DEC currently maintains a low-cost community sensor in Soldotna and several other nearby communities on the Kenai Peninsula. Continuous hourly data for these sensors can be found on the DEC real-time air monitoring website1.
Only two exceedances of the NAAQS occurred between 2011-2014 at the Soldotna site. In total, zero days exceeded the 24-hour PM10 NAAQS of 150 µg/m3 . A total of two days exceeded the 24-hour PM2.5 NAAQS of 35 µg/m3 during the Funny River Fire on the Kenai Peninsula in May 2014. Due to incomplete data capture design values could not be calculated for the site except in 2014 when the exceptional events were included the 24-hour design value was 46 µg/m3 . However, the 24-hour design value for that year, excluding exceptional events, was 15 µg/m3 but was not considered valid due to data not meeting completeness criteria with the exclusion of wildfire impacted days.
Introduction
The State of Alaska Department of Environmental Conservation (DEC) is mandated by the Alaska State Legislature to “conserve, improve, and protect its natural resources and environment and control water, land, and air pollution, in order to enhance the health, safety, and welfare of the people of the state and their overall economic and social well-being” under Alaska Statue 46.03.010. The DEC Division of Air Quality operates a statewide air monitoring network with permanent regulatory monitoring sites in Juneau, Anchorage/Matanuska-Susitna Valley (Mat-Su Valley), and Fairbanks, as well as additional special purpose or temporary sites. This report provides information about air monitoring conducted in Soldotna between 2011 and 2014 on the Kenai Peninsula.
Background
The Soldotna monitoring site was established in 2011 at 144 N Binkley Street, Soldotna, Alaska 99669 under U.S. Environmental Protection Agency (EPA) site number 02-122-0008. The site was a special purpose monitoring (SPM) site intended to be a part of the Cook Inlet Regional Integrated Air Monitoring System (CIRIAMS) monitoring network to provide real-time data to the public and help DEC issue more timely air quality advisories. CIRIAMS was a federally funded grant program sponsored by the Municipality of Anchorage and in partnership with DEC that placed PM10 and PM2.5 monitoring sites across the Cook Inlet region to provide real-time air monitoring data to the public and air quality/public health decision makers.
The site was closed in July 2014 due to budget constraints. DEC notified EPA of the shutdown of this SPM site though prior approval from EPA for the closure of SPM sites is not required (40 CFR 58.2 (f)). No regulatory grade monitoring currently occurs on the Kenai Peninsula, but DEC maintains a low-cost community sensor in Soldotna and several other nearby communities on the Kenai Peninsula.
Site Description
The Soldotna monitoring site was established in 2011 at 144 N Binkley Street, Soldotna, Alaska 99669 (Figure 1). The Soldotna site was in an urban and residential area of the Kenai Peninsula Borough located between Park Avenue to the north, Shady Lane to the south, North Binkley Street to the west, and Barbara Erickson Street to the east. The site is less than 1 mile away from the Kenai Spur Highway to the east and the Sterling Highway to the south. The monitoring site was a fenced in trailer that sat to the east of the back parking lot of the Kenai Peninsula Borough office building (Figure 2).
Over the time that the site was operating (2011-2014) the population of Soldotna was around 4,300 residents, with 4,284 residents in 2011, 4,299 in 2012, 4,284 again in 2013, and 4,311 residents in 2014 (Figure 3)2,3,4,5. Over that time, the average population size was 4,295 residents and the median number of residents was 4,292 residents.
Soldotna climate typically has average winter lows of 10˚F in January and summer highs of 64˚F in July. Wind tends to flow in a weak east-west direction. Wildfires are common on the Kenai Peninsula between May and September.


Nearby Sources
The primary source of emissions nearby to the monitoring site in Soldotna is vehicle traffic on the Kenai Spur Highway to the east and the Sterling Highway to the south, both within one mile of the site. Land use nearby to the site is office spaces, schools, and residential homes. The Kenai Peninsula is seasonally affected by wildfires.
Results
Particulate matter monitoring at the Soldotna monitoring site was intended as an SPM site under the CIRIAMS monitoring network to provide real-time air quality data to the public and decision-makers. The site utilized regulatory grade federal equivalent method (FEM) instruments to continuously measure PM2.5 and PM10 (Table 1). DEC utilized beta attenuation monitors (BAMs) for measuring particulate matter. BAM particulate matter monitoring uses a glass-fiber filter tape that lasts several weeks. This sampling method involves drawing ambient air through a size-selective inlet over an hour period, depositing particulate on the filter tape. The sampler measures the amount of beta radiation that passes through the tape before and after the sample is collected and uses that data to calculate the particulate matter concentration in micrograms per cubic meter (µg/m3 ). Flow rate, flow duration, ambient temperature, and ambient barometric pressure are then used to calculate concentration.
| Years | Pollutant / Parameter Code | Method Code | Method Type | Sample Frequency | Analysis Type | Instrument |
|---|---|---|---|---|---|---|
| 2011-2014 | PM2.5 88101 | 170 | FEM | Hourly | Beta Attenuation | Met One BAM-1020 PM2.5 VSCC |
| 2012-2014 | PM10 81102 | 122 | FEM | Hourly | Beta Attenuation | Met One BAM-1020 PM10 |
FEM data undergo quality assurance (QA) checks by DEC before it is uploaded to the EPA’s national database of ambient air quality data, the Air Quality System (AQS). This data is available for the public at https://www.epa.gov/outdoor-air-quality-data. DEC and EPA use this data to determine whether the air quality of a locality meets the NAAQS set by the EPA. A standard is a maximum allowable concentration that must not be exceeded over a set averaging time, against which a pollutant is compared or measured. Most standards set an upper bound to a pollutant. EPA has two methods for determining compliance, or attainment, with ambient air quality standards: deterministic and probabilistic.
A deterministic method allows a certain (low) number of exceedances over a set time and a specific number of valid samples. EPA uses this method to determine compliance with the 24-hour PM10 NAAQS of 150 µg/m3 under standard conditions of temperature and pressure. An area complies with this NAAQS if the sum of its valid samples does not exceed the standard more than once per year on average over a 3-year period with a data capture rate of at least 75%.
A probabilistic method allows for multiple exceedances if the distribution of sampled values is such that a set statistic is less than the NAAQS. This method makes compliance with the NAAQS less sensitive to extreme conditions that may not be typical of the local area. EPA uses this method to determine compliance with the PM2.5 24-hour NAAQS of 65 µg/m3 (1997-2006) or 35 µg/m3 (2006-present) and with the annual NAAQS if the 3-year weighted annual mean is less than 15 µg/m3 (1997-2006), 12 µg/m3 (2006-2024), or 9 µg/m3 (2024-present)6. The NAAQS for PM2.5 became stricter over the years due to research on the negative health impacts of fine particulate and the desire to be more protective of human health.
EPA’s probabilistic methods employ a statistic called the “design value”. Design values can be calculated from the sample data, using modeling results, or be a count of the number of exceedances of a NAAQS. Design values change from year to year depending on meteorological conditions, pollutant levels, and unusual events.
The EPA does have a process by which data arising from unusual or “exceptional” events can be excluded from the data set used to determine compliance with a standard. EPA introduced an exceptional events policy in 2007 where ambient air monitoring agencies can request exceptional event waivers to exclude these events from calculations of design values. DEC commonly requests exceptional event waiver requests for Fairbanks North Star Borough monitoring site data due to the frequency of wildfires in the summer months in the area.
If an area cannot meet an air quality standard, the EPA through the powers outlined in the Clean Air Act, may designate it as a “non-attainment” area. This designation triggers a five-year window during which the state must gather additional data, must submit a State Implementation Plan to the EPA, must institute control measures, and must meet the standard at the end of that time. EPA can levy sanctions against a designated non-attainment area that may result in legal obligations or sanctions including the loss of federal highway funding and of economic development opportunities.
PM10 Monitoring
PM10 monitoring in Soldotna started in January 2012 and stopped in May 2014. There was a brief gap in monitoring from August 2013 to December 2013. During the three years of PM10 monitoring in Soldotna, zero exceedances of the 150 µg/m3 PM10 NAAQS were recorded (Table 2 and Figure 4).
| 1st Max | Date of 1st Max | 2nd Max | Date of 2nd Max | POC |
|---|---|---|---|---|
| 131 | 2012-12-07 | 108 | 2012-04-10 | 3 |
| 84 | 2013-06-26 | 68 | 2013-04-15 | 3 |
| 96 | 2014-05-22 | 90 | 2014-03-31 | 3 |

PM2.5 Monitoring
PM2.5 monitoring in Soldotna began in October 2011 and ended in June 2014. Monitoring was continuous from October 2011 until July 2013 when there was a brief pause in monitoring efforts until February 2014. Monitoring was then discontinued altogether in June 2014. Generally, PM2.5 was well below the PM2.5 NAAQS during this period (Figure 5).

Only two exceedances of the 24-hour PM2.5 NAAQS of 35 µg/m3 were recorded at the site between 2011-2014 (Table 3). These exceedances on May 24 and May 26, 2014, were during the Funny River Fire and were flagged as wildfire affected days. The fire started on May 19, 2024, at approximately 7 p.m., burning more than 43,000 acres by May 21, 2014. The Funny River Fire lasted until June 7, 2014, and burned nearly 200,000 acres7. The only data from the Soldotna monitoring site between 2011-2014 annotated with wildfire flags was collected on May 24 and May 26, 2014. DEC can request that wildfire days be excluded from calculations of design values with exceptional event waiver requests but typically it has only done so for the Fairbanks North Star Borough which is in non-attainment of the 24-hour and Annual PM2.5 NAAQS. Exceptional event waivers are intended to exclude wildfire smoke impacted data from design value calculations, as wildfires are a naturally occurring event that cannot be regulated. Excluding wildfire smoke impacted days from design value calculations results in a value that is more in line with human contributions made to PM2.5 pollution.
| Date | PM2.5 (µg/m3) | Qualifier |
|---|---|---|
| 2014-05-24 | 121.4 | RT – Wildfire U.S. |
| 2014-05-26 | 114.5 | RT – Wildfire U.S. |
As monitoring only occurred between October 2011 and June 2014, with disruptions in monitoring efforts from July 2013 to February 2014 a valid annual design value could not be calculated for the site and the 2014 24-hour design value was only valid when exceptional events (the Funny River Fire impacted days) were included in the calculation (Table 4).
| Year | 98th percentile | 98th percentile (exceptional events excluded) | Weighted mean | Weighted mean (exceptional events excluded) | 24-hour design value | 24-hour design value (exceptional events excluded | Annual design value | Annual design value (exceptional events excluded |
|---|---|---|---|---|---|---|---|---|
| 2011 | 8.2* | 8.2* | 2.9* | 2.9* | 8* | 8* | 2.9* | 2.9* |
| 2012 | 7.4 | 7.4 | 1.0 | 1.0 | 8* | 8* | 1.9* | 1.9* |
| 2013 | 8.3* | 8.3* | 0.9* | 0.9* | 8* | 8* | 1.6* | 1.6* |
| 2014 | 121.4 | 29.7* | 10.8* | 8.3* | 46 | 15* | 4.2* | 3.4* |
*value does not meet completeness criteria
Conclusions
Between 2011 and 2014, DEC monitored ambient concentrations of particulate matter (PM10 and PM2.5) in Soldotna. The site was closed in 2014 due to budget issues. While the site was open only two exceedances of the PM2.5 24-hour NAAQS of 35 µg/m3 were recorded. These exceedances occurred on May 24 and 26, 2014 during the Funny River Fire and both days were qualified as wildfire affected days. Due to incomplete data capture between 2011-2014 valid design values could not be calculated for the site except in 2014 the 24-hour design value with exceptional events included (Funny River Fire impacted days) was 46 µg/m3 , however, the 24-hour design value for that year excluding exceptional events was 15 µg/m3 , but was not considered valid due to data not meeting completeness criteria with the exclusion of wildfire impacted days.
Appendix
| 1st Max | Date of 1st Max | Notes | 2nd Max | Date of 2nd Max | Notes | POC |
|---|---|---|---|---|---|---|
| 8.6 | 2011-11-19 | none | 8.2 | 2011-11-21 | none | 3 |
| 8.7 | 2012-01-13 | none | 8.3 | 2012-01-18 | none | 3 |
| 11.7 | 2013-06-26 | none | 8.7 | 2013-06-17 | none | 3 |
| 29.7 | 2014-05-27 | Exceptional events excluded | 26.4 | 2014-05-25 | Exceptional events excluded | 3 |
| 121.4 | 2014-05-24 | Exceptional events included | 114.5 | 2014-05-26 | Exceptional events included | 3 |
| 121.4 | 2014-05-24 | Exceptional events with EPA concurrence excluded | 114.5 | 2014-05-26 | Exceptional events with EPA concurrence excluded | 3 |
Note: Some years have multiple values listed as the first maximum when exceptional events with and without EPA concurrence were excluded or included in the calculation. Notes on the how the values were calculated are made in the “Notes” column. Years with only one value either had no exceptional events or the first maximum was the same regardless of the inclusion or exclusion of exceptional events and no note is included in the “Notes” column in those cases.
Footnotes
-
https://dec.alaska.gov/air/air-monitoring/responsibilities/database-management/alaska-air-quality-real-time-data/↩︎
-
Alaska Population Overview 2010 Census and 2011 Estimates. October 2012. Alaska Department of Labor and Workforce Development. https://live.laborstats.alaska.gov/pop/estimates/pub/1011popover.pdf. Retrieved May 28, 2025.↩︎
-
Alaska Population Overview 2012 Estimates. November 2013. Alaska Department of Labor and Workforce Development. https://live.laborstats.alaska.gov/pop/estimates/pub/12popover.pdf. Retrieved May 28, 2025.↩︎
-
Alaska Population Overview 2013 Estimates. February 2015. Alaska Department of Labor and Workforce Development. https://live.laborstats.alaska.gov/pop/estimates/pub/13popover.pdf. Retrieved May 28, 2025.↩︎
-
Alaska Population Overview 2014 Estimates. May 2016. Alaska Department of Labor and Workforce Development. https://live.laborstats.alaska.gov/pop/estimates/pub/14popover.pdf. Retrieved May 28, 2025.↩︎
-
Timeline of Particulate Matter (PM) National Ambient Air Quality Standards (NAAQS) EPA. Last updated on December 31, 2024. https://www.epa.gov/pm-pollution/timeline-particulate-matter-pm-national-ambient-air-quality-standards-naaqs. Retrieved April 29, 2025.↩︎
-
Kenai Moose and the Funny River Fire. November 2014. Riley Woodford Alaska Department of Fish and Game. https://www.adfg.alaska.gov/index.cfm?adfg=wildlifenews.view_article&articles_id=689. Retrieved May 28, 2025.↩︎
 Indicates an external site.