2025 Air Monitoring Network Plan Public Comment Draft
Published May 21, 2025
List of Tables
- Table 1 DEC Regulatory Monitoring Sites
- Table 2 Alaska’s Core Based Statistical Areas
- Table 3 Summary of Monitoring Network Compliance by CBSA and Pollutant
- Table 4 Minimum SLAMS Monitoring Site Requirements for Alaskan CBSAs
- Table 5 Alaska Regulatory Monitoring Sites as of May 2024
- Table 6 CO Monitoring Sites in Anchorage and Fairbanks as of May 2024
- Table 7 PM Monitoring Sites in Alaska as of May 2025
- Table 8 NCore Gaseous1 Monitoring and Meteorological Monitoring
- Table 9 DEC Monitoring Site Compliance Summary
- Table 10 Anchorage MSA Monitors
- Table 11 Fairbanks MSA - NCore Monitors
- Table 12 Fairbanks MSA – A Street Monitors
- Table 13 Fairbanks MSA – Hurst Road Monitors
- Table 14 Juneau µSA: Floyd Dryden Monitors
- Table 15 Site Level Monitoring Objectives
- Table 16 Anchorage MSA: Instrument-Level Monitoring Purposes & Objectives
- Table 17 Fairbanks NCore: Instrument-Level Monitoring Purposes & Objectives
- Table 18 Fairbanks A Street: Instrument-Level Monitoring Purposes & Objectives
- Table 19 Fairbanks Hurst Road: Instrument-Level Monitoring Purposes & Objectives
- Table 20 Juneau: Instrument-Level Monitoring Purposes & Objectives
- Table 21 Monitors required by Nonattainment Area (NAA) or Limited Maintenance Plan (LMP)
- Table 22 2025 Collocations
Appendices
- Table 23 PM2.5 DV Under Local/Actual Conditions (µg/m3)
- Table 24 DV Ozone (O3) (ppm)
- Table 25 DV Sulfur Dioxide (SO2) (ppb)
- Table 26 DV Carbon Monoxide (CO) (ppm)
- Table 27 PM10 DV Under Standard Conditions (µg/m3)
- Table 28 PM2.5 Network Evaluation Form
- Table 29 PM2.5 SLAMS Sites Required per Population
- Table 30 PM2.5 Monitoring Requirements
- Table 31 PM10 Network Evaluation Form
- Table 32 Number of PM10 Stations within AMQA Regulatory Network
- Table 33 PM10 Minimum Monitoring Requirements
- Table 34 CO Site Evaluation Form
- Table 35 CO SLAMS Sites Required per Population
- Table 36 O3 Network Evaluation Form
- Table 37 O3 SLAMS Sites Required per Population
- Table 38 SLAMS O3 Monitoring Minimum Requirements
- Table 39 Ozone Monitoring Season by State
- Table 40 SO2 Network Evaluation Form
- Table 41 SO2 SLAMS Sites Required per Population
- Table 42 Minimum SO2 Monitoring Requirements
- Table 43 NO2 Network Evaluation Form
- Table 44 NO2 SLAMS Sites Required Per Population
- Table 45 Summary of Appendix E Forms: PM2.5, PM10, and PM10-2.5
- Table 46 Summary of Appendix E Forms: CO
- Table 47 Summary of Appendix E Forms: O3, SO2, NO, Diff, and NOy
- Table 48 Blank Part 58 Appendix E Form for PM
- Table 49 Blank Part 58 Appendix E Form for CO
- Table 50 Blank Part 58 Appendix E Form for O3
- Table 51 Blank Part 58 Appendix E Form for SO2
- Table 52 Blank Part 58 Appendix E Form for NO, NOx, NO2, and NOy
- Table 53 Roadway ADT for CO, O3, SO2, and NO suite Part 58 Appendix E Forms
List of Figures
- Figure 1 Alaska 2020 Core Based Statistical Areas and Counties
List of Acronyms
- ADT average daily traffic
- AMQA Air Monitoring and Quality Assurance Program
- ANP annual network plan
- AQI air quality index
- AQS Air Quality Systems
- ARM Approved Regional Method
- ARP The American Rescue Plan
- BAM beta attenuation monitor
- CAA Clean Air Act
- CASTNET Clean Air Status and Trends Network
- CBJ City & Borough of Juneau
- CBSA Core Based Statistical Area
- Census the Census Bureau
- CFR Code of Federal Regulations
- CO carbon monoxide
- CSA Combined Statistical Area
- CSN Chemical Speciation Network
- DEC Alaska Department of Environmental Conservation
- DV design value
- Diff difference between NOy and NO
- EEWR exceptional event waiver request
- EPA U.S. Environmental Protection Agency
- FEM Federal Equivalent Method
- FNSB Fairbanks North Star Borough
- FRM Federal Reference Method
- HVAC heating and ventilation air conditioning system
- IMPROVE Interagency Monitoring of Protected Visual Environments
- LC local (actual) conditions of temperature and pressure
- LMP limited maintenance plan
- m3 cubic meter
- Mat-Su Matanuska Susitna
- MFC mass flow controller
- MOA Municipality of Anchorage
- MSA metropolitan statistical area
- µg micrograms
- µg/m3 micrograms per cubic meter
- µSA micropolitan statistical area
- NA not applicable
- NAA nonattainment area
- NAAQS National Ambient Air Quality Standards
- NCore National Core Multi-Polluant Monitoring Stations
- NO nitric oxide
- NO2 nitrogen dioxide
- NOy reactive nitrogen compounds
- NOx nitrogen oxides
- NWS National Weather Service
- O3 ozone
- OMB U.S. Office of Management and Budget
- Pb lead
- Pb-TSP lead total suspended particulate
- PM particulate matter
- PMC Plant Materials Center
- PM2.5 particulate matter with an aerodynamic diameter less than 2.5 micrometers
- PM10 particulate matter with an aerodynamic diameter less than 10 micrometers
- POC parameter occurrence code
- ppb parts per billion
- ppm parts per million
- RadNet Radiation Monitoring Network
- RH relative humidity
- R10 U.S. EPA Region 10
- S scalar
- SCC sharp cut cyclone
- SIP State Implementation Plan
- SLAMS State and Local Air Monitoring Stations
- SO2 sulfur dioxide
- SPM special purpose monitor
- STD standard conditions of temperature and pressure
- Tamb ambient temperature
- V vector
- VPD vehicles per day
- VSCC very sharp cut cyclone
- WD wind direction
- WGS World Geodetic System
- WS wind speed
Executive Summary
The 2025 Annual Network Plan (ANP) for the Alaska Department of Environmental Conservation (DEC) outlines the state’s air quality monitoring strategy, ensuring compliance with 40 CFR Part 58 and protecting public health and the environment. DEC is committed to ensuring that all Alaskans, regardless of location, have access to clean air and information about air quality.
Overview:
DEC’s air quality monitoring efforts focus on population centers and areas with historical air quality concerns, measuring criteria pollutants as mandated by the EPA. Due to ongoing budget constraints, the network is maintained at a minimum regulatory level, with no expansion planned in the near future. However, DEC is innovating to address Alaska’s unique challenges, such as its vast geography and rural communities, through targeted initiatives.
Key Updates in 2024/25
NCore Site (Fairbanks): Upgraded the Met One BAM 1020 continuous PM2.5 instrument to Federal Equivalent Method (FEM) status by replacing the Sharp Cut Cyclone (SSC) with a Very Sharp Cut Cyclone (VSCC) on January 2, 2025. This upgrade enhances data reliability for Air Quality Index (AQI) reporting and supports local air quality management.
A-Street Site (Fairbanks): Converted the BAM 1020 PM2.5 instrument to FEM status on January 2, 2024, and replaced the monitoring shelter in Q3 2024 to improve durability.
Hurst Road (North Pole): Replaced the aging SO2 analyzer in mid-2024 with a Teledyne T100U for better data reliability, supporting studies on sulfur/sulfate ratios and biomass fuel impacts.
Proposed Changes for 2025
Garden Site (Anchorage): DEC will discontinue Carbon Monoxide (CO) monitoring due to consistently low levels over the past 20 years. This change has been approved pending EPA approval of a State Implementation Plan (SIP) modification that removes the monitoring requirement. This will conclude the second 10-year Limited Maintenance Plan period.
Low-Cost Sensor Network: Deployment of up to 55 QuantAQ Modulair™ sensor pods to establish a community sensor network, enhancing monitoring in rural and outlying communities. Currently, 5 pods are at regulatory sites, and 36 are in rural areas, with more to be deployed.
Innovation and Community Engagement
DEC’s low-cost sensor network represents significant innovation, addressing Alaska’s vast geography. By providing real-time data to rural communities, DEC empowers residents to protect their health and engage in air quality improvement efforts. This aligns with national trends in community-scale monitoring.
Public Health
DEC is dedicated to protecting public health by ensuring accurate air quality data informs policy and public actions. Underserved and rural communities are included in DEC’s efforts to improve air quality statewide.
Stakeholder Engagement
DEC values public input and encourages participation in the ANP development process. The plan is open for public comment, and air quality data is accessible online, fostering transparency and community involvement. DEC collaborates with the EPA and stakeholders to meet regulatory requirements and address community needs.
Conclusion
As Alaska moves forward, DEC remains committed to advancing its air monitoring capabilities, leveraging technology and collaboration to safeguard public health and the environment for all Alaskans.
1 Introduction
This document is the 2025 Annual Monitoring Network Plan submitted by the Alaska Department of Environmental Conservation (DEC) to fulfill the requirements of 40 CFR 58.10. Federal regulations mandate that each state establish and maintain an air quality surveillance system, including State and Local Air Monitoring Stations (SLAMS), National Core Multi-Monitoring (NCore) stations, PM2.5 Chemical Speciation Network (CSN) stations, and Special Purpose Monitoring (SPM) stations.
This plan describes Alaska’s current air quality monitoring network, ensures compliance with federal regulations, and outlines anticipated changes, including proposals to remove or move monitoring stations within 18 months following plan submittal. All required monitoring stations must be operational by January 1, 2025, and the plan is due to the EPA Regional Administrator by July 1, 2025.
The plan provides detailed information for each existing and proposed monitoring site, such as Air Quality System (AQS) site identification numbers, locations, sampling methods, and operating schedules, as outlined in subsequent sections.
This plan was made available for public inspection and comment for at least 30 days prior to submission to the EPA, as required by 40 CFR 58.10, via the DEC website. All comments received have been reviewed and addressed as appropriate.
Alaska’s vast geography and remote communities present unique challenges for air quality monitoring. This plan addresses these through innovative strategies, such as expanding low-cost sensor networks in rural areas.
The DEC is committed to maintaining a robust air quality monitoring network that meets or exceeds EPA standards, protecting public health and the environment through regulatory compliance and stakeholder engagement.
2 Air Quality Monitoring Requirements
2.1 Regulatory Framework
The Alaska Department of Environmental Conservation (DEC) is required by 40 CFR 58.10 to establish and maintain an air quality surveillance system, including State and Local Air Monitoring Stations (SLAMS), National Core Multi-Monitoring (NCore) stations, PM2.5 Chemical Speciation Network (CSN) stations, and Special Purpose Monitoring (SPM) stations. This plan ensures compliance with federal regulations, including 40 CFR 58, Appendices A, C, D, and E, which cover data quality assurance, monitoring methods, network design criteria, and specific location criteria. DEC’s monitoring network is designed to meet these requirements while addressing Alaska’s unique environmental and geographic challenges.
2.2 Monitoring Priorities and Strategy
DEC prioritizes monitoring the six criteria pollutants regulated under the National Ambient Air Quality Standards (NAAQS): particulate matter PM2.5 and PM10), sulfur dioxide (SO2), nitrogen dioxide (NO2), carbon monoxide (CO), ozone (O3), and lead (Pb). Monitoring efforts are focused on population centers such as Anchorage, Fairbanks, and Juneau, as well as rural and remote areas where unique sources like wildland fires, road dust, and biomass burning significantly influence air quality. DEC collaborates with local governments and tribal villages to ensure comprehensive coverage, particularly for PM10 in rural communities and PM2.5 during wildfire seasons. This strategy aligns with federal requirements while addressing Alaska’s distinct air quality challenges.
2.3 Current Monitoring Network
As of May 2024, Alaska’s ambient air monitoring network includes the following sites, strategically located to meet minimum monitoring requirements for Alaskan Core-Based Statistical Areas (CBSAs).
| Region | Site | AQS ID | Location | Pollutants Monitored | Station Type |
|---|---|---|---|---|---|
| Anchorage MSA | Garden | 02-020-0018 | 3000 East 16th Ave., Anchorage, AK |
PM10 PM2.5 CO |
SLAMS |
| Anchorage MSA | Laurel | 02-020-0045 | 4335 Laurel St., Anchorage, AK | PM10 | SLAMS |
| Anchorage MSA | Parkgate | 02-020-1004 | 11723 Old Glenn Hwy., Eagle River, AK | PM10 | SLAMS |
| Anchorage MSA | Plant Materials Center | 02-170-0010 | 5310 Bodenburg Spur Rd., Palmer, AK |
PM10 PM2.5 |
SLAMS |
| Fairbanks MSA | A Street | 02-090-0040 | 397 Hamilton Ave., Fairbanks, AK | PM2.5 | SLAMS |
| Fairbanks MSA | NCore | 02-090-0034 | 907 Terminal St., Fairbanks, AK |
PM10 PM2.5 PM10-2.5 CO SO2 O3 NO NOy Speciation |
NCore |
| Fairbanks MSA | Hurst Road | 02-090-0035 | 3288 Hurst Rd., North Pole, AK |
PM2.5 SO2 Speciation |
SPM |
| Juneau µSA | Floyd Dryden | 02-110-0004 | 3800 Mendenhall Loop Rd., Juneau, AK |
PM10 PM2.5 |
SLAMS |
Detailed information for each site, including sampling methods, operating schedules, and compliance with siting criteria, is provided in Section 3 of this plan. The network exceeds minimum requirements in several areas, particularly for PM2.5 and PM10, ensuring robust data collection for public health protection.
2.4 Compliance with Federal Standards
DEC ensures compliance with federal standards through:
-
Network Evaluation Forms: Completed for each criteria pollutant under 40 CFR 58, Appendix D, confirming that the network meets design and minimum monitoring requirements.
-
Siting Evaluation Forms: Completed under 40 CFR 58, Appendix E, ensuring proper siting of all monitors.
-
Data Quality Assurance: Adherence to 40 CFR 58, Appendix A for SLAMS and SPM monitors.
-
Monitoring Methods: Compliance with 40 CFR 58, Appendix C for approved monitoring methods.
-
Waivers: Any waivers requested or granted by the EPA Regional Administrator are detailed in Section 8.
2.5 Planned Enhancements
To enhance monitoring capabilities, DEC is expanding its low-cost sensor network, currently consisting of 55 QuantAQ ModularTM sensor pods. These sensors provide real-time data in rural and outlying communities, improving coverage and enabling quicker responses to air quality events. As of May 2025:
-
Regulatory Sites: 5 pods are operational at NCore (Fairbanks), Garden (Anchorage), and Floyd Dryden (Juneau).
-
Rural Communities: 36 pods are deployed across Alaska, including Big Lake, Cordova, Denali National Park, and others.
-
Future Expansion: Research into WiFi-enabled sensors is underway to expand coverage in areas with limited cellular service.
Additionally, DEC plans to discontinue CO monitoring at the Garden site, pending EPA approval of a State Implementation Plan (SIP) modification, to optimize resources while maintaining compliance.
2.6 Public Engagement
This plan was made available for public inspection and comment for at least 30 days prior to submission to the EPA, as required by 40 CFR 58.10. The plan is accessible via the DEC website. All comments received have been reviewed and addressed as appropriate in this final version. DEC values public input and encourages continued engagement to ensure transparency and stakeholder involvement.
3 State of Alaska Ambient Air Monitoring Network
The State of Alaska Ambient Air Monitoring Network, managed by the Alaska Department of Environmental Conservation (DEC), plays a vital role in safeguarding public health and the environment by monitoring air quality across Alaska’s diverse landscapes. The network complies with federal regulations under 40 CFR 58.10, collecting precise data on criteria pollutants, including particulate matter (PM2.5 and PM10) carbon monoxide (CO), ozone (O3), sulfur dioxide (SO2), nitrogen dioxide (NO2), and lead (Pb). The network consists of State and Local Air Monitoring Stations (SLAMS), Special Purpose Monitors (SPMs), and a National Core (NCore) site, designed to address Alaska’s unique geographic and climatic challenges, such as extreme weather and sparse population distribution.
3.1 Minimum Monitoring Requirements
3.1.1 Federal Regulatory Framework
Federal regulations under 40 CFR 58.10 requires states to establish and maintain air monitoring networks based on population sizes within Core Based Statistical Areas (CBSAs), as defined by the U.S. Office of Management and Budget (OMB) and the Census Bureau. Alaska’s network monitors four CBSAs: Anchorage Metropolitan Statistical Area (MSA), Fairbanks MSA, Juneau Micropolitan Statistical Area (µSA), and Ketchikan µSA. These requirements ensure adequate coverage of pollutants affecting public health and compliance with National Ambient Air Quality Standards (NAAQS).
3.1.2 Core-Based Statistical Areas (CBSAs)
| Core Base Statistical Areas | Population1 |
|---|---|
|
(Municipality of Anchorage and Matanuska-Susitna Borough) |
401,314 |
| Municipality of Anchorage | 289,600 |
| Matanuska-Susitna Borough | 117,613 |
|
Fairbanks North Star Borough |
94,951 |
|
City and Borough of Juneau |
31,572 |
|
Ketchikan Gateway Borough |
13,677 |
3.1.3 Pollutant Monitoring Requirements
The DEC ensures compliance with minimum monitoring requirements for criteria pollutants across CBSAs, as outlined in Table 3 and Table 4 . No monitoring is required for Ketchikan µSA due to low population and pollutant levels. Anchorage, Fairbanks, and Juneau meet or exceed requirements for PM, CO, and ozone, with specific waivers noted in Section 3.5 .
| CBSA | Pollutant | Required | Actual | Compliance Status |
|---|---|---|---|---|
| Anchorage MSA | PM2.5 | 1 | 1 | Meets Requirements |
| Anchorage MSA | PM10 | 1 | 1 | Meets Requirements |
| Anchorage MSA | CO | 1 | 1 | Meets Requirements (Waiver Pending) |
| Fairbanks MSA | PM2.5 | 1 | 1 | Meets Requirements |
| Fairbanks MSA | PM10 | 1 | 1 | Meets Requirements |
| Fairbanks MSA | CO | 1 | 1 | Meets Requirements |
| Fairbanks MSA | SO2 | 0 | 1 | Exceeds Requirements |
| Fairbanks MSA | NO2 | 0 | 1 | Exceeds Requirements |
| Juneau µSA | PM2.5 | 0 | 1 | Exceeds Requirements |
| Juneau µSA | PM10 | 0 | 1 | Exceeds Requirements |
| Ketchikan µSA | All | 0 | 0 | Meets Requirements |
| Criteria Pollutant | Comments | Anchorage MSA | Fairbanks MSA | Juneau µSA | Ketchikan µSA |
|---|---|---|---|---|---|
| PM2.5 | Most recent 3-year design value ≥ 85% of NAAQS | 0 | 1 | 0 | 0 |
| PM2.5 | Most recent 3-year design value < 85% of NAAQS | 0 | 0 | 0 | 0 |
| PM10 | Two monitoring sites based on PM10 Limited Maintenance Plans (Juneau and Eagle River). | 0-1 | 0 | 0 | 0 |
| Pb | Waiver for source-oriented monitoring - see Section 3.1.1 | 0 | 0 | 0 | 0 |
| CO | Two monitoring sites based on CO Limited Maintenance Plans (Fairbanks and Anchorage); Fairbanks also meets NCore requirement | 0 | 0 | 0 | 0 |
| O3 | Most recent 3-year design value ≥ 85% of NAAQS | 02 | 0 | 0 | 0 |
| SO2 | NCore site requirement | 0 | 0 | 0 | 0 |
| NO2 | Requirement based on population numbers. Alaska does not meet the threshold requirement | 0 | 0 | 0 | 0 |
3.1.4 Lead
Alaska does not meet the population thresholds for lead monitoring and no lead monitoring is currently conducted. However, DEC received a waiver from the EPA in 2021 for source-oriented lead monitoring at the Red Dog Mine, as per 40 CFR 58 Appendix D. This waiver is contingent upon the submission of additional data-supported justifications and updated dispersion modeling to ensure the continued representativeness of the underlying lead demonstration. For more details, see the waiver for source-oriented monitoring at Red Dog Mine (Section 3.5.2).
3.1.5 Appendix D & E Siting Forms
EPA Region 10 provided evaluation forms in 2014, updated by DEC in 2024, to ensure compliance with siting criteria in 40 CFR 58, Appendices D and E. These forms are included in Section 10.
3.2 Current Monitoring Sites
The DEC operates and maintains a network of regulatory monitoring sites to ensure compliance with the NAAQS. Table 5 provides the site name, address, geographic coordinates, and identification number for all air monitoring sites submitting data to the EPA Air Quality System (AQS) database as of May 2025.
The parameters measured at the NCore site include PM10, PM2.5, PM10-2.5 (coarse fraction), CO, O3, SO2, NOy, NO, PM2.5 chemical speciation, and meteorological parameters.
There are three collocated sites: Garden (PM2.5 and PM10), Hurst Road (PM2.5), and A Street (PM2.5), which are described further in Table 22. All the primary and secondary monitors at these locations are situated within one to four meters of each other to ensure data comparability. A full list of parameters measured at each site is described in Table 5.
| Site Name | AQS ID | Location (Address, Lat/Long) | CBSA | Parameters Monitored | Monitoring Objectives | Spatial Scale | Compliance Notes |
|---|---|---|---|---|---|---|---|
| Garden | 02-020-0018 |
3000 East 16th Ave. Anchorage, AK 61.205861 N 149.824602 W |
Anchorage MSA |
PM2.5 PM10 CO |
NAAQS Comparison, Public Info | Neighborhood | Waiver for CO monitoring pending |
| Laurel | 02-020-0045 |
4335 Laurel St. Anchorage, AK 61.181117 N 149.834003 W |
Anchorage MSA |
PM2.5 PM10 |
NAAQS Comparison | Neighborhood | Meets Requirements |
| Parkgate | 02-020-1004 |
11723 Old Glenn Hwy. Eagle River, AK 61.326700 N 149.569707 W |
Anchorage MSA |
PM2.5 PM10 |
NAAQS Comparison | Neighborhood | Meets Requirements |
| Plant Materials Center | 02-170-0010 |
5310 Bodenburg Spur Rd. Palmer, AK 61.522780 N 149.083714 W |
Anchorage MSA | PM2.5 | Public Info | Neighborhood | Meets Requirements |
| A Street | 02-090-0040 |
397 Hamilton Ave. Fairbanks, AK 64.84593 N 147.69327 W |
Fairbanks MSA | PM2.5 | NAAQS Comparison | Microscale | Siting waiver granted |
| NCore | 02-090-0034 |
907 Terminal St.3 Fairbanks, AK 64.845307 N 147.72552 W |
Fairbanks MSA |
PM2.5 PM10 CO SO2 NO2 O3 NOy Met |
NAAQS Comparison, Research | Neighborhood | Meets Requirements |
| Hurst Road4 | 02-090-0035 |
3288 Hurst Rd. North Pole, AK 64.762973 N 147.310297 W |
Fairbanks MSA |
PM2.5 SO2 Met |
NAAQS Comparison | Neighborhood | Meets Requirements |
| Floyd Dryden | 02-110-0004 |
3800 Mendenhall Loop Road Juneau, AK 58.388889 N |
Juneau µSA |
PM2.5 PM10 |
Public Info | Neighborhood | Meets Requirements |
3.3 Siting Criteria
The DEC ensures that its eight ambient air monitoring sites comply with siting criteria outlined in 40 CFR Part 58, Appendix E. These criteria guarantee accurate and representative air quality data, critical for public health and regulatory compliance.
In 2014, EPA Region 10 provided site evaluation forms to assess compliance with the probe and monitoring path siting criteria specified in 40 CFR Part 58, Appendix E. These forms were distributed to the individual site operators for completion. Summaries of the completed site evaluation forms are organized into three tables – PM, CO and all other gaseous pollutants – and are presented in Section 10 of this report.
Monitoring site photos and location maps can be found at: https://dec.alaska.gov/air/air-monitoring/instruments-sites/.
The operation of each monitoring site complies with the requirements outlined in 40 CFR Part 58, Appendix A. Furthermore, all SPM sites are operated following the same protocols as SLAMS, thereby ensuring full compliance with these requirements.
3.3.1 Carbon Monoxide Sites
Carbon monoxide (CO) monitoring sites adhere to the siting criteria outlined in 40 CFR 58, Appendix C, ensuring accurate measurement of CO concentrations. Key requirements include:
-
Probe Inlets: Positioned at least 1 meter from structures to avoid interference.
-
Probe Heights: 2.5-3.5 meters for micro-scale or 3-15 meters for other scales.
-
Airflow: Unobstructed for at least 270 degrees (or 180 degrees for building-side probes).
-
Obstructions: At least twice the height of dominant CO sources to minimize local influences.
CO monitoring occurs at Garden (AQS ID: 02-020-0018) and NCore (AQS ID: 02-090-0034). Table 6 lists the CO monitoring sites in Anchorage and Fairbanks.
In the 2024 ANP, EPA R10 provisionally approved the discontinuation of the CO monitor at the Anchorage Garden site (AQS ID: 02-020-0018), contingent upon approval of a State Implementation Plan (SIP) modification wherein the monitor is not required. This approval was based on the monitor showing attainment during the previous five years and having a probability of less than 10% of exceeding 80% of the CO NAAQS over the next three years.
| Site Name | Monitoring Scale | Probe Distance from Wall (meters) | Height (meters) | Unrestricted Air Flow | Spacing from Roadway (meters) | Trees |
|---|---|---|---|---|---|---|
|
Garden 02-020-0018 |
Neighborhood | 1 | 3 | 180 degrees unobstructed | 7.6 | Yes5 |
|
NCore 02-090-0034 |
Neighborhood | Not applicable | 3 | 360 degrees unobstructed | 70 | 10 m |
3.3.2 Particulate Matter (PM10 and PM2.5) Sites
Particulate matter (PM10 and PM2.5) monitoring sites comply with 40 CFR 58, Appendix D, ensuring representative data for population exposure and NAAQS compliance. Key requirements include:
-
Probe Heights: 2-7 meters for micro-scale or 2-15 meters for other scales.
-
Separation from Walls: Minimum 2 meters to avoid airflow restrictions.
-
Airflow: Unobstructed for at least 270 degrees (or 180 degrees for street canyon sites).
-
Roadway spacing: 2-10 meters for street canyon sites, 5-15 meters for traffic corridors, or based on traffic volume for other scales.
-
Traffic and Trees: Traffic volume typically <10,000 vehicles per day (VPD); no trees within 10 meters to prevent particle interference.
PM monitoring occurs at Garden, Laurel, Parkgate, Plant Materials Center, A-Street. Hurst Road, NCore, and Floyd Dryden. A-Street operates under a siting waiver due to its proximity to a roadway (Section 8, Waiver C-2).
Table 7 lists all PM monitoring sites in Alaska and summarizes their compliance with the siting criteria specific in Appendix E of 40 CFR Part 58 (see also Section 10).
|
Site Name AQS Codes |
Monitoring Scale PM10 | Monitoring Scale PM2.5 | Height (meters) | Spacing from Obstructions (meters) | Spacing from Roadway (meters) | Traffic (VPD)6 | Trees within 10 meters? |
|---|---|---|---|---|---|---|---|
|
Garden 02-020-0018 |
Neighborhood | Neighborhood | 11.2 | No Obstructions | 14 | 770 Sunrise Dr 1,280 Airport Heights Dr. | No |
|
Laurel 02-020-0045 |
Microscale | - | 6.4 | No Obstructions | 11 | 29,500 Tudor Rd7 | No |
|
Parkgate 02-020-1004 |
Neighborhood | Neighborhood | 10.4 | No Obstructions | 44 | 13,300 Old Glenn Hwy8 | No |
|
Plant Materials Center 02-170-0010 |
Neighborhood | Neighborhood | 4.4 | No Obstructions | 180 | 60 5310 Bodenburg Spur Rd | No |
|
A-Street 02-090-0040 |
- | Neighborhood | 4.3 | No Obstructions | 5.89 | 1,30010 Hamilton Ave 3,770 Farewell Ave | No |
|
NCore 02-090-0034 |
Neighborhood | Neighborhood | 4.5 | No Obstructions | 70 |
5,250 Phillips Field Rd 850 Driveway St |
No |
| Hurst Road 02-090-0035 | - | Neighborhood | 4.7 | No Obstructions | 21 | 3,400 Hurst Rd | No |
| Floyd Dryden 02-110-0004 | Neighborhood | Neighborhood | 10 | No Obstructions | 100 | 16,000 Mio-Mendenhall Loop Road | No |
3.3.3 NCore Site
The NCore site in Fairbanks (AQS ID: 02-090-0034), part of the National Core multi-pollutant monitoring network, measures PM2.5, PM10, CO, SO2, O3, NO, NOy, and meteorological parameters at a neighborhood scale. It adheres to the siting criteria for each parameter, as specified in 40 CFR 58, Appendices C, D, and E, ensuring comprehensive data for research and compliance.
Table 9 summarizes siting compliance for all Alaska monitoring sites.
| Parameter Name | Monitoring Scale | Height (meters) | Spacing from Obstructions (meters) | Spacing from Roadway (meters) | Traffic (VPD) | Trees < 10 m? |
|---|---|---|---|---|---|---|
| NOy, NO & Diff | Neighborhood | 312 | No Obstructions | 70 | 5,25013 | None |
| O3 | Neighborhood | 3 |
No Obstructions |
70 | 5,250 | None |
|
SO2 (1 hr & 5 min) |
Neighborhood | 3 | No Obstructions | 70 | 5,250 | None |
| Tamb, WS, & WD | Neighborhood | 3 | No Obstructions | 70 | 5,250 | None |
| Tamb, WS, & WD | Neighborhood | 10 |
No Obstructions |
70 | 5,250 | None |
| Relative Humidity | Neighborhood | 3 | No Obstructions | 70 | 5,250 | None |
3.3.4 Compliance Summary
All sites comply with 40 CFR Part 58, Appendix E, as verified by 2024 site evaluation forms (Section 10). Waivers are noted for Garden (CO) and A Street (siting). Table 9 summarizes site compliance.
|
Site Name (AQS ID) |
Compliance Status | Siting Criteria Met | Waivers/ Exemptions |
|---|---|---|---|
|
Garden 02-020-0018 |
Compliant; Pending CO waiver | Yes | Pending CO waiver (Section 8, Waiver C-1) |
|
Laurel 02-020-0045 |
Fully Compliant | Yes | None |
|
Parkgate 02-020-1004 |
Fully Compliant | Yes | None |
|
Plant Materials Center 02-170-0010 |
Fully Compliant | Yes | None |
|
A Street 02-090-0040 |
Compliant; Siting waiver granted | Yes | Siting waiver for roadway proximity (Section 8, Waiver C-2) |
|
NCore 02-090-0034 |
Fully Compliant | Yes | None |
|
Hurst Road 02-090-0035 |
Fully Compliant | Yes | None |
|
Floyd Dryden 02-110-0004 |
Fully Compliant | Yes | None |
3.4 Monitoring Methods, Designation, and Sampling Frequency
The Alaska Department of Environmental Conservation (DEC) operates an ambient air monitoring network to measure air quality across eight sites in Alaska. This section details the monitoring methods, designations, and sampling frequencies used to collect data on pollutants such as particulate matter (PM2.5, PM10), carbon monoxide (CO), sulfur dioxide (SO2), nitrogen dioxide (NO2), ozone (O3), reactive nitrogen compounds (NOy), and meteorological parameters. These methods ensure compliance with federal regulations under 40 CFR Part 58, providing accurate data for public health protection, regulatory compliance, and research. Detailed data for each site, including pollutant parameters, AQS codes, and equipment, is presented in Table 9, Table 10, Table 11, Table 12, Table 13, Table 14, Table 15, and Table 16, with summaries provided below.
Monitoring Methods and Designations
Monitoring methods are the techniques used to measure air pollutants, designated as reference or equivalent by the U.S. Environmental Protection Agency (EPA). Reference methods are federally approved standards, while equivalent methods meet specific performance criteria. Designations indicate the purpose of the data collected, categorized as:
-
SLAMS (State and Local Air Monitoring Stations)
- Demonstrate compliance with National Ambient Air Quality Standards (NAAQS).
-
SPM (Special Purpose Monitors)
- Conduct general air quality assessments, such as research and trend analysis.
-
CSN (Chemical Speciation Network)
- Evaluate atmospheric chemistry to understand pollution sources.
The EPA’s Air Quality System (AQS) database uses specific codes to standardize data:
-
Parameter Codes
- 5-digit codes identifying pollutants (e.g. PM10, SO2, wind speed).
-
Parameter Occurrence Codes (POCs)
-
1-digit codes indicating the sampler’s role:
-
1: Primary data source
-
2: Secondary (collocated) source
-
3: Continuous measurement
-
-
-
Method Codes
- Describe analytical techniques (e.g. chemiluminescence for nitric oxide, gravimetric analysis for particulate matter).
Sampling Frequency
Sampling frequency indicates how often pollutant concentrations are measured, determined by federal regulations to ensure sufficient data for NAAQS compliance and public health monitoring. Frequencies are tailored to each pollutant and site, based on 40 CFR Part 58, Appendix D for particulate matter and Appendix C for gaseous pollutants.
Common notations include:
-
1/6
- One sample every sixth day, following EPA’s national monitoring schedule14.
-
Continuous
- Real-time or near-real-time measurements (e.g. 1-minute SO2 readings, 1-hour PM2.5 readings via BAM).
Equipment and Additional Monitoring
Each monitoring site uses specific equipment tailored to the pollutants measured, listed in Table 9, Table 10, Table 11, Table 12, Table 13, Table 14, Table 15, Table 16, and Table 17 with corresponding AQS parameter codes. The DEC also operates additional sites for rural road dust and wildland fire monitoring, which are not submitted to the AQS database; details are in Section 11. Alaska participates in the Interagency Monitoring of Protected Environments (IMPROVE) network, focusing on scenic visibility in National Parks and wilderness areas, described in Section 12. A Summary of pollutant concentration data (NAAQS design values, maxima, averages) is provided in Section 6.
Compliance Summary
The DEC’s monitoring methods, designations, and sampling frequencies meet or exceed federal standards, ensuring reliable air quality data across Alaska. By adhering to 40 CFR Part 58, the network supports public health, regulatory compliance, and research. Detailed information is available in Appendices A, E, F, and G, and on the DEC’s Air Monitoring Website.
|
Site Name/ Location/ AQS ID |
Pollutant Parameter15 | Monitor Designation | Monitor Starting Date | AQS Parameter/ Occurrence Code | AQS Method Codes | Sample Frequency | Equipment |
|---|---|---|---|---|---|---|---|
|
Garden/ Anchorage 02-020-0018 |
PM10STD/ PM10LC | SLAMS | 1/1/2009 STD 1/1/2015 LC | 81102-3/ 85101-3 | 122 | Continuous | Met One BAM 1020 - FEM |
|
Garden/ Anchorage 02-020-0018 |
PM10STD/ PM10LC | SLAMS | 2/24/2022 | 81102-2/ 85101-2 | 126 | 1/6 | Thermo Scientific Partisol 2000i - FRM |
|
Garden/ Anchorage 02-020-0018 |
PM2.5LC | SLAMS | 1/1/2009 | 88101-3 | 170 | Continuous | Met One BAM 1020 (VSCC) FEM |
|
Garden/ Anchorage 02-020-0018 |
PM2.5LC | SLAMS | 2/22/2022 | 88101-2 | 143 | 1/6 | Thermo Scientific Partisol 2000i (VSCC) - FRM |
|
Garden/ Anchorage 02-020-0018 |
CO | SLAMS | 1/1/1979 | 42101-1 | 554 | Continuous | Thermo Scientific Model 48i-TLE -FRM |
|
Laurel/ Anchorage 02-020-0045 |
PM10STD/ PM10LC | SPM | 5/28/2015 | 81102-3/ 85101-3 | 122 | Continuous | Met One BAM 1020 - FEM |
|
Parkgate/ Eagle River 02-020-1004 |
PM10STD/ PM10LC | SLAMS | 1/1/2009 STD 1/1/2015 LC | 81102-3/ 85101-3 | 122 | Continuous | Met One BAM 1020 - FEM |
|
Plant Materials Center/ Matanuska-Susitna Valley 02-170-0010 |
PM10STD/ PM10LC | SLAMS | 10/26/2023 | 81102-3/ 85101-3 | 122 | Continuous | Met One BAM 1020 - FEM |
|
Plant Materials Center/ Matanuska-Susitna Valley 02-170-0010 |
PM2.5LC | SLAMS | 10/26/2023 | 88101-3 | 170 | Continuous | Met One BAM 1020 (VSCC) - FEM |
|
Plant Materials Center/ Matanuska-Susitna Valley 02-170-0010 |
WD (V) 10 m | SLAMS | 10/8/2024 | 61104-1 | 065 | Continuous | RM Young Anemometer |
|
Plant Materials Center/ Matanuska-Susitna Valley 02-170-0010 |
WD (V) 3 m | SLAMS | 6/5/2024 | 61104-2 | 065 | Continuous | RM Young Anemometer |
|
Plant Materials Center/ Matanuska-Susitna Valley 02-170-0010 |
WS (V) 10 m | SLAMS | 10/8/2024 | 61103-1 | 065 | Continuous | RM Young Anemometer |
|
Plant Materials Center/ Matanuska-Susitna Valley 02-170-0010 |
WS (V) 3 m | SLAMS | 6/5/2024 | 61103-2 | 065 | Continuous | RM Young Anemometer |
|
Plant Materials Center/ Matanuska-Susitna Valley 02-170-0010 |
Ambient Temp 3 m | SLAMS | 5/31/2024 | 62101-2 | 040 | Continuous | Met One T-200 RTD Sensor |
|
Plant Materials Center/ Matanuska-Susitna Valley 02-170-0010 |
Ambient Temp 10 m | SLAMS | 10/1/2024 | 62101-1 | 040 | Continuous | Met One T-200 RTD Sensor |
| Pollutant Parameter | Monitor Designation | AQS Monitor Starting Date | AQS Parameter - Occurrence Code | AQS MethodCodes | Sample Frequency | Equipment |
|---|---|---|---|---|---|---|
| PM10STD/ PM10LC | NCore | 2/15/2011 | 81102-3/ 85101-3 | 122 | Continuous | Met One BAM 1020 FEM |
| PM2.5LC | SPM | 2/15/2011 | 88101-3 | 731 | Continuous | Met One BAM 1020 (VSCC) FEM |
| PM2.5LC | NCORE | NCore/4/2009 | 88101-1 | 145 | 1/1 | Thermo Scientific Sequential Partisol 2025i (VSCC)-FRM |
| PM10LC - PM2.5LC | NCore | 2/15/2011 | 86101-1 | 185 | 1/3 | Paired Met One BAM 1020 FEM |
| CO | NCore | 8/1/2011 | 42101-1 | 593 | Continuous | Teledyne T300U-FRM |
| SO2 (1-hr)/ SO2 (5-min) | NCore | 8/1/2011/ 8/18/2011 | 42401-1 / 42401-2 | 560 | Continuous | Thermo Scientific 43iQ-TL-FEM |
| NOy | NCore | 10/5/2012 | 42600-1 | 699 | Continuous | Teledyne T-200U-NOy |
| NO | NCore | 10/5/2012 | 42601-2 | 699 | Continuous | Teledyne T-200U-NOy |
| NOy-NO | NCore | 10/5/2012 | 42612-1 | 699 | Continuous | Teledyne T-200U-NOy |
| O3 | NCore | 8/1/2011 | 44201-1 | 047 | Continuous | Thermo Scientific 49iQ-TL-FEM |
| WD (V) 10 m | NCore | 4/5/2011 | 61104-1 | 068 | Continuous | RM Young Ultrasonic Anemometer |
| WD (V) 3 m | NCore | 4/5/2011 | 61104-2 | 068 | Continuous | RM Young Ultrasonic Anemometer |
| WS (V) 10 m | NCore | 4/5/2011 | 61103-1 | 068 | Continuous | RM Young Ultrasonic Anemometer |
| WS (V) 3 m | NCore | 4/5/2011 | 61103-2 | 068 | Continuous | RM Young Ultrasonic Anemometer |
| RH | NCore | 11/4/2013 | 62201-1 | 061 | Continuous | Met One Relative Humidity Sensor |
| Ambient Temp 3 m | NCore | 4/1/2011 | 62101-2 | 040 | Continuous | Met One T-200 RTD Sensor |
| Ambient Temp 10 m | NCore | 4/1/2011 | 62101-1 | 040 | Continuous | Met One T-200 RTD Sensor |
| PM2.5LC Speciation | NCore/CSN | 1/1/2015 | Multiple1 | Multiple1 | 1/3 | URG 3000N |
| PM2.5LC Speciation | NCore/CSN | 1/1/2015 | Multiple1 | Multiple1 | 1/3 | Met One Super SASS |
| Pollutant Parameter | Monitor Designation | AQS Monitor Starting Date | AQS Parameter -Occurrence Code | AQS Method Codes | Sample Frequency | Equipment |
|---|---|---|---|---|---|---|
| PM2.5LC | SLAMS | 7/15/2019 | 88101-1 | 145 | 1/1 |
Thermo Scientific Sequential Partisol 2025i (VSCC)-FRM |
| PM2.5LC | SPM | 1/2/2024 | 88101-3 | 170 | Continuous |
Met One BAM 1020 (VSCC) FEM |
| Ambient Temp 3 m | SPM | 10/1/2019 | 62101-2 | 040 | Continuous | Met One T-200 RTD Sensor |
| Ambient Temp 10 m | SPM | 10/1/2019 | 62101-1 | 040 | Continuous | Met One T-200 RTD Sensor |
| WD (V) 3 m | SPM | 10/1/2019 | 61104-2 | 068 | Continuous | RM Young Ultrasonic Anemometer |
| WS (V) 3 m | SPM | 10/1/2019 | 61103-2 | 068 | Continuous | RM Young Ultrasonic Anemometer |
| WD (V) 10 m | SPM | 10/1/2019 | 61104-1 | 068 | Continuous | RM Young Ultrasonic Anemometer |
| WS (V) 10 m | SPM | 10/1/2019 | 61103-1 | 068 | Continuous | RM Young Ultrasonic Anemometer |
| Pollutant Parameter | Monitor Designation | AQS Monitor Starting Date | AQS Parameter -Occurrence Code | AQS Method Codes | Sample Frequency | Equipment |
|---|---|---|---|---|---|---|
| PM2.5LC | SLAMS | 3/1/2012 | 88101-1 | 145 | 1/1 | Thermo Scientific Sequential Partisol 2025i (VSCC)-FRM |
| PM2.5LC collocate | SLAMS | 7/18/2019 | 88101-2 | 145 | 1/3 | Thermo Scientific Sequential Partisol 2025i (VSCC) |
| SO2 (1-hr)/ SO2 (5-min) | SPM | 3/10/2022/ 3/10/2022 | 42401-1/ 42401-2 | 560 | Continuous | Thermo Scientific 43i TL-FEM |
| PM2.5LC | SPM | 3/1/2012 | 88501-3/ 88502-3 | 731 | Continuous | Met One BAM 1020 (SCC) non-FEM |
| PM2.5LC Speciation | CSN | 8/1/2019 | Multiple | Multiple | 1/3 | URG 3000N |
| PM2.5LC Speciation | CSN | 8/1/2019 | Multiple | Multiple | 1/3 | Met One Super SASS |
| Ambient Temp 23 m | SPM | 9/24/2019 | 62101-3 | 040 | Continuous | Met One T-200 RTD Sensor |
| Ambient Temp 10 m | SPM | 9/24/2019 | 62101-1 | 040 | Continuous | Met One T-200 RTD Sensor |
| Ambient Temp 3 m | SPM | 9/24/2019 | 62101-2 | 040 | Continuous | Met One T-200 RTD Sensor |
| WD16 (V) 23 m | SPM | 9/24/2019 | 61104-3 | 068 | Continuous | Met One Ultrasonic Anemometer |
| WS (V) 23 m | SPM | 9/24/2019 | 61103-3 | 068 | Continuous | Met One Ultrasonic Anemometer |
| WD (V) 10 m | SPM | 9/24/2019 | 61104-1 | 068 | Continuous | Met One Ultrasonic Anemometer |
| WS (V) 10 m | SPM | 9/24/2019 | 61103-1 | 068 | Continuous | Met One Ultrasonic Anemometer |
| WD (V) 3 m | SPM | 9/24/2019 | 61104-2 | 068 | Continuous | Met One Ultrasonic Anemometer |
| WS (V) 3 m | SPM | 9/24/2019 | 61103-2 | 068 | Continuous | Met One Ultrasonic Anemometer |
| RH | SPM | 3/29/2024 | 62201-1 | 061 | Continuous | Campbell Scientific Relative Humidity Sensor |
| Pollutant Parameter | Monitor Designation | Monitor Starting Date | AQS Parameter and Occurrence Code17 | AQS Method Codes | Sample Frequency | Equipment |
|---|---|---|---|---|---|---|
| PM2.5LC | SPM | 6/23/2021 | 88502-3 | 238 | Continuous | Teledyne T640X – non-FEM |
| PM2.5LC | SPM | 2/18/2024 | 88101-2 | 145 | 1/3 | Thermo Scientific Partisol 2025i (VSCC) - FRM |
| PM10STD/ PM10LC | SPM | 6/23/2021 | 81102-3/ 85101-3 | 239 | Continuous | Teledyne T640X - FEM |
| Ambient Temp 3 m | SPM | 1/1/2024 | 62101-2 | 040 | Continuous | Teledyne T640X - FEM |
| WD (V) 3 m18 | SPM | 1/1/2022 | 61104-1 | 065 | Continuous | RM Young Ultrasonic Anemometer |
| WS (V) 3 m | SPM | 1/1/2022 | 61103-1 | 065 | Continuous | RM Young Ultrasonic Anemometer |
| Site Name | AQS ID | Pollutant(s) |
Monitoring Objectives 40 CFR Part 58 App D 1.1.1 |
|---|---|---|---|
| Garden | 02-020-0018 | PM10/ PM2.5/ CO |
b. Typical concentrations (population density based) d. General background concentration levels |
| Laurel | 02-020-0045 | PM10 |
a. Highest concentrations expected in area c. Impact of significant sources/source categories |
| Parkgate | 02-020-1004 | PM10 |
b. Typical concentrations (population density based) d. General background concentration levels |
| NCore | 02-090-0034 | PM10/ PM2.5/ PM10-PM2.5/ CO/ SO2/ O3/ NO/ NOy/ Speciation |
b. Typical concentrations (population density based) d. General background concentration levels |
| Hurst Road | 02-090-0035 | PM2.5/ SO2/ Speciation |
a. Highest concentrations expected in area c. Impact of significant sources/source categories |
| A Street | 02-090-0040 | PM2.5 |
a. Highest concentrations expected in area c. Impact of significant sources/source categories |
| Plant Materials Center | 02-170-0010 | PM10/ PM2.5 |
a. Highest concentrations expected in area c. Impact of significant sources/source categories |
| Floyd Dryden Middle School | 02-110-0004 | PM10/ PM2.5 |
b. Typical concentrations (population density based) d. General background concentration levels |
| Site Name/ Location/ AQS ID | Pollutant Parameter | AQS Parameter/ Occurrence Code | AQS Monitoring Objective | Monitoring Purpose(s) |
|---|---|---|---|---|
|
Garden/ Anchorage 02-020-0018 |
PM10STD/ PM10LC | 81102-3/ 85101-3 | Population exposure |
-Provide timely air pollution information -Determine ambient air quality standard compliance |
|
Garden/ Anchorage 02-020-0018 |
PM10STD/ PM10LC collocated | 81102-2/ 85101-2 | Population exposure | -Determine ambient air quality standard compliance |
|
Garden/ Anchorage 02-020-0018 |
PM2.5LC | 88101-3 | Population exposure |
-Provide timely air pollution information -Determine ambient air quality standard compliance |
|
Garden/ Anchorage 02-020-0018 |
PM2.5LC collocated | 88101-2 | Population exposure | -Determine ambient air quality standard compliance |
|
Garden/ Anchorage 02-020-0018 |
CO | 42101-1 | Population exposure |
-Provide timely air pollution information -Determine ambient air quality standard compliance |
|
Laurel/ Anchorage 02-020-0045 |
PM10STD/ PM10LC | 81102-3/ 85101-3 |
Source Oriented Highest Concentration |
-Provide timely air pollution information -Determine ambient air quality standard compliance |
|
Parkgate/ Eagle River 02-020-1004 |
PM10STD/ PM10LC | 81102-3/ 85101-3 | Population exposure |
-Provide timely air pollution information -Determine ambient air quality standard compliance |
|
Plant Materials Center/ Mat-Su Valley 02-170-0010 |
PM10STD/ PM10LC | 81102-3/ 85101-3 | Population exposure |
-Provide timely air pollution information -Determine ambient air quality standard compliance |
|
Plant Materials Center/ Mat-Su Valley 02-170-0010 |
PM2.5LC | 88101-3 |
Population exposure Highest Concentration |
-Provide timely air pollution information -Determine ambient air quality standard compliance |
| Pollutant Parameter | AQS Parameter/ Occurrence Code | AQS Monitoring Objective | Monitoring Purpose(s) |
|---|---|---|---|
| PM10STD/ PM10LC | 81102-3 | Population exposure |
-Provide timely air pollution information - Determine ambient air quality standard compliance -Support air pollution research studies |
| PM2.5LC | 88101-3 | Population exposure |
-Provide timely air pollution information -Support air pollution research studies |
| PM2.5LC | 88101-1 | Population exposure |
-Determine ambient air quality standard compliance -Support air pollution research studies |
| PM10LC - PM2.5LC | 86101-1 | Population exposure |
-Determine ambient air quality standard compliance -Support air pollution research studies |
| CO | 42101-1 | Population exposure |
-Provide timely air pollution information -Determine ambient air quality standard compliance -Support air pollution research studies |
| SO2 (1-hr) | 42401-1 | Population exposure |
-Provide timely air pollution information -Determine ambient air quality standard compliance -Support air pollution research studies |
| SO2 (5-min) | 42401-2 | Population exposure |
-Determine ambient air quality standard compliance -Support air pollution research studies |
| NOy | 42600-1 | Population exposure | -Support air pollution research studies |
| NO | 42601-2 | Population exposure | -Support air pollution research studies |
| NOy-NO | 42612-1 | Population exposure | -Support air pollution research studies |
| O3 | 44201-1 | Population exposure |
-Provide timely air pollution information -Determine ambient air quality standard compliance -Support air pollution research studies |
| WD | 61104-1 | Population exposure |
-Provide timely air pollution information -Support air pollution research studies |
| WS | 61103-1 | Population exposure |
-Provide timely air pollution information -Support air pollution research studies |
| BP | 64101-1 | Population exposure |
-Provide timely air pollution information. -Support air pollution research studies |
| RH | 62201-1 | Population exposure |
-Provide timely air pollution information. -Support air pollution research studies |
| Ambient Temp 3 m | 62101-2 | Population exposure |
-Provide timely air pollution information. -Support air pollution research studies |
| Ambient Temp 10 m | 62101-1 | Population exposure |
-Provide timely air pollution information. -Support air pollution research studies |
| PM2.5LC Speciation | Multiple* | Population exposure |
-Support air pollution research studies -part of CSN |
| Pollutant Parameter | AQS Parameter/ Occurrence Code | AQS Monitoring Objective | Monitoring Purpose(s) |
|---|---|---|---|
| PM2.5LC | 88101-1 |
Population exposure Highest Concentration |
-Determine ambient air quality standard compliance |
| PM2.5LC | 88101-3 | Population exposure | -Provide timely air pollution information |
| Ambient Temp 3 & 10 m | 62101-2,1 | Population exposure | -Provide timely air pollution information |
| WD 3 & 10 m | 61104-2,1 | Population exposure | -Provide timely air pollution information |
| WS 3 & 10 m | 61103-2,1 | Population exposure | -Provide timely air pollution information |
| Pollutant Parameter | AQS Parameter/ Occurrence Code | AQS Monitoring Objective | Monitoring Purpose(s) |
|---|---|---|---|
| PM2.5LC | 88101-1 |
Population exposure Highest Concentration |
-Determine ambient air quality standard compliance |
| PM2.5LC | 88501-3/ 88502-3 | Population exposure | -Provide timely air pollution information |
| PM2.5LC collocated | 88101-2 | Population exposure | -Determine ambient air quality standard compliance |
| PM2.5LC Speciation | Multiple | Population exposure |
-Support air pollution research studies -part of CSN |
|
SO2 (1-hr) |
42401-1 | Population exposure |
-Provide timely air pollution information -Determine ambient air quality standard compliance -Support air pollution research studies |
|
SO2 (5-min) |
42401-2 | Population exposure |
-Determine ambient air quality standard compliance -Support air pollution research studies |
| Ambient Temp 3, 10, & 23 m | 62101-2,1,3 | Population exposure | -Provide timely air pollution information |
| WD 3, 10, & 23 m | 61104-2,1,3 | Population exposure | -Provide timely air pollution information |
| WS 3, 10, & 23 m | 61103-2,1,3 | Population exposure | -Provide timely air pollution information |
| Pollutant Parameter | AQS Parameter/ Occurrence Code | AQS Monitoring Objective | Monitoring Purpose(s) |
|---|---|---|---|
| PM10STD/ PM10LC | 81102-3/ 85101-3 | Population exposure |
-Provide timely air pollution information -Determine ambient air quality standard compliance -Support air pollution research studies |
| PM2.5LC | 88101-1 | Population exposure | -Determine ambient air quality standard compliance |
| PM2.5LC | 88502-3 | Population exposure | -Provide timely air pollution information |
| MSA or µSA | Site Name/ Location | AQS ID | Pollutant Parameter | AQS Parameter/ Occurrence Code | Required by NAA or LMP? |
|---|---|---|---|---|---|
| Fairbanks MSA | Hurst Road/ North Pole | 02-090-0035 | PM2.5LC | 88101-1 | Fairbanks PM2.5 NAA |
| Fairbanks MSA | NCore/ Fairbanks | 02-090-0034 | CO | 42101-1 | Fairbanks CO LMP |
| Anchorage MSA | Garden/ Anchorage | 02-020-0018 | CO | 42101-1 | Anchorage CO LMP |
| Anchorage MSA | Parkgate/ Eagle River | 02-020-1004 | PM10STD | 81102-3 | Eagle River PM10 LMP |
| Juneau µSA | Floyd Dryden Middle School/ Juneau | 02-110-0004 | PMSTD | 81102-3 | Juneau PM10 LMP |
|
Site Name/ Location AQS ID |
Pollutant Parameter | AQS Parameter/ Occurrence Code | AQS Method Code | Equipment | Primary or Secondary |
|---|---|---|---|---|---|
|
Garden/ Anchorage 02-020-0018 |
PM2.5LC | 88101-3 | 170 | Met-One BAM 1020 | Primary |
|
Garden/ Anchorage 02-020-0018 |
PM2.5LC collocate | 88101-2 | 143 | Thermo Scientific Partisol 2000i | Secondary |
|
Garden/ Anchorage 02-020-0018 |
PM10STD | 81102-3/ 85101-3 | 122 | Met-One BAM 1020 | Primary |
|
Garden/ Anchorage 02-020-0018 |
PM10STD collocate | 81102-2/ 85101-2 | 126 | Thermo Scientific Partisol 2000i | Secondary |
|
Hurst Road/ North Pole 02-090-0035 |
PM2.5LC | 88101-1 | 145 | Thermo Scientific Partisol 2025i | Primary |
|
Hurst Road/ North Pole 02-090-0035 |
PM2.5LC collocate | 88101-2 | 145 | Thermo Scientific Partisol 2025i | Secondary |
|
A Street/ Fairbanks 02-090-0040 |
PM2.5LC | 88101-1 | 145 | Thermo Scientific Partisol 2025i | Primary |
|
A Street/ Fairbanks 02-090-0040 |
PM2.5LC collocate | 88101-3 | 170 | Met-One BAM 1020 | Secondary |
3.5 Monitoring Waivers
3.5.1 Anchorage MSA Ozone Monitoring
On October 15th, 2018, EPA granted a waiver of the ozone monitoring requirement for the Anchorage MSA. The MSA’s population triggered a monitoring obligation, but historical ozone measurements throughout the area consistently showed concentrations well below 80% of the NAAQS. This waiver was valid through 2023.
Following a request from DEC in the 2023 ANP, EPA approved a five-year extension of the waiver on October 30th, 2023, pursuant to 40 CFR Part 58, Appendix D, Section 4.1(b). EPA concurred with the DEC’s assessment that ozone levels in the Anchorage MSA remain well below 80% of the NAAQS, with a continued low likelihood of exceedances. The current waiver is effective through October 2028.
The waiver extension is included in the 2023 Alaska ANP Approval Letter and can be found on the DEC’s ANP website (Air Monitoring Network Plans).
3.5.2 Lead Source Oriented Monitoring
To address source-oriented lead monitoring requirements at the Red Dog Mine, DEC consulted with EPA and pursued a modeling demonstration to show compliance with the lead NAAQS at the ambient boundary. On August 11, 2016, the EPA approved Alaska’s initial waiver request for lead monitoring at the Red Dog Mine based on dispersion modeling results, which demonstrated that the maximum 3-month rolling average lead concentration at the mine boundary did not exceed 50% of the lead NAAQS. Pursuant to 40 CFR Part 58, Appendix D, Section 4.5(a)(ii), this waiver must be renewed every five years as part of the Alaska 5-year Air Monitoring Network Assessment.
The DEC submitted an updated waiver request to the EPA on June 12, 2020, which included a new modeling analysis performed by Teck Alaska Inc., the mine operator, and reviewed by the DEC. The EPA approved the renewed waiver on December 7, 2021. The DEC is currently working with the EPA and Teck Alaska Inc. on the next waiver renewal in conjunction with the 2025 5-year Air Monitoring Network Assessment.
During the most recent review, Teck Alaska’s preliminary report indicated an increase in overall emissions. Because previous modeling showed that the Red Dog Mine emissions were near the waiver threshold, the EPA requested updated emission rates and new modeling runs. The updated modeling results will inform the current renewal process.
The EPA approval letters for the lead monitoring waivers are included in Section 8 (Waiver C-3) and are also available on the DEC’s website19.
3.5.3 A-Street Siting Waiver Request
The A-Street SLAMS station is located in a residential neighborhood on the east side of Fairbanks, adjacent to Nordale Elementary School. This site was selected due to its proximity to homes with moderate levels of solid fuel heating and its status as a PM2.5 hotspot, making it an ideal maximum impact site for the Fairbanks Air Quality Zone. Placement on school district property provides long-term site stability and ensures monitoring of a sensitive population.
To minimize disruption to school activities while being close enough to homes to be representative of neighborhood conditions, the monitoring station was sited less than the recommended 15 meters away from the A Street roadway – specifically, 3 meters from the sidewalk and the start of the paved shoulder. While this distance is below the standard specified in 40 CFR Part 58, Appendix E, the roadway experiences minimal traffic and is often snow- or ice-covered for much of the year, reducing the potential for direct roadway PM impacts. The primary monitoring objective is to quantify emissions from residential solid fuel burning; thus, roadway contributions to measured PM2.5 concentrations are expected to be negligible.
On October 30th, 2023, the EPA approved a waiver for the proximity-to-roadway siting criteria at the A Street site, pursuant to 40 CFR Part 58, Appendix E, Figure E-1. EPA concurred that the site is sufficiently representative of neighborhood-scale air quality for the intended monitoring objectives. Documentation of waiver approval is included in the 2023 Alaska ANP Approval Letter in Section 8 (Waiver C-2).
4 Network Modifications Completed in 2025
4.1 Anchorage Garden Site CO monitoring
Over the past two decades, carbon monoxide (CO) concentrations in Anchorage have declined significantly, with no exceedances of the NAAQS reported. For the past three years, 8-hour maximum CO values have remained below 30% of the NAAQS and have not exceeded 41% in the last 10 years.
Given these sustained low concentrations, the DEC will seek a State Implementation Plan (SIP) modification to conclude the second 10-year Limited Maintenance Plan period. The DEC plans to continue CO monitoring as long as the instrument remains operational until the modification is approved. If the monitor fails and is not repairable, DEC has a sensor pod at the station with a collocation history with the regulatory monitor and may inform DEC of any need for contingency measures, until the SIP modification is approved.
4.2 National Core Multipollutant Site
In 2025, the BAM 1020 PM2.5 monitor was upgraded to FEM status, by replacing a sharp cut cyclone (SSC) with a very sharp cut cyclone (VSCC).
5 Planned Network Modifications For 2025
5.1 Regulatory Monitoring Stations
At this time, the DEC does not anticipate any changes to the regulatory ambient air monitoring network for 2026.
5.2 Low-Cost Sensor Network
While the existing long-term regulatory monitoring network meets federal requirements for the number of stations and pollutants monitored, it is primarily limited to Alaska’s population centers and does not adequately characterize conditions in outlying and rural communities.
Recent advances in sensor technology have enabled the development and commercial availability of smaller, portable, and more affordable air quality sensors. This new generation of low-cost sensor technology provides the DEC with the opportunity to expand air quality monitoring into areas that were previously cost-prohibitive to reach.
Beginning in 2023, the DEC launched the Community-Based Air Monitoring project, deploying QuantAQ MODULAIRTM low-cost sensor pods across the state. The sensor network is designed to provide real-time air quality data and trend information, empowering community members to better understand baseline air quality in their areas. While the data collected are non-regulatory, they are available to the public upon request and are displayed in real time on the DEC’s website20.
The QuantAQ MODULAIRTM sensors measure particulate matter (PM2.5 and PM10), carbon monoxide (CO), nitric oxide (NO), nitrogen dioxide (NO2), ozone (O3), temperature, and relative humidity. As of 2025, the DEC operates 55 Quant AQ ModulairTM sensor pods statewide.
These sensor pods are deployed in a wide range of communities, including: Anchorage (Campbell Creek Science Center), Big Lake, Cordova, Delta Junction, Denali National Park, Fairbanks (2 sites: Goldstream and Badger Road), Galena, Glennallen, Haines, Homer, Hoonah, Juneau (2 sites: 5th Street and the State Museum), Kenai, Ketchikan, Kodiak, Kotzebue, Napaskiak, Nenana, Ninilchik, Nome, Palmer, Seward, Sitka, Skagway, Soldotna, Sutton-Alpine, Talkeenta, Tok, Tyonek, Valdez, Wasilla, Willow, Wrangell, and Yakutat. Additionally, six quality assurance sensor pods are collocated at regulatory monitoring sites: Fairbanks NCore (3), Anchorage Garden (2), and the Juneau Floyd Dryden (1).
During the initial rollout, the DEC identified that cellular network coverage in some Alaskan communities was incompatible with the communication systems of the primary sensor pod manufacturers. To address this, the DEC is actively researching alternative WiFi-enabled sensors to further expand the network in areas where cellular service is limited or unavailable.
6 Appendix A NAAQS Summary Tables
| PM2.5 Monitoring Sites | AQS Site ID | 2024 98th Percentile | 2023 98th Percentile | 2022 98th Percentile | 2024 Weighted Annual Mean | 2023 Weighted Annual Mean | 2022 Weighted Annual Mean | 2024 24-hour Design Value | 2024 Annual Design Value |
|---|---|---|---|---|---|---|---|---|---|
| Garden/ Anchorage | 02-020-0018 | 16.8 | 14.2 | 24.0 | 5.0 | 4.2 | 4.9 | 18 | 4.7 |
| Butte/ Matanuska-Susitna Valley | 02-170-0008 | NA | 17.5 | 21.2 | NA | 4.1 | 4.4 † | NA | NA |
| Plant Materials Center/ Matanuska Susitna Valley | 02-170-0010 | 16.2 | NA | NA | 3.8 | NA | NA | NA | NA |
| NCore Site/ Fairbanks | 02-090-0034 | 24.0 (35.8) | 20.0 (30.7) | 29.1 (76.3) | 6.7 (8.5) | 6.4 (8.4) | 6.7 (11.3) | 24 (48) | 6.6 (9.4) |
| Hurst Rd/ North Pole | 02-090-0035 | 54.0 (57.3) | 51.9 (62.5) | 51.2 (72.5) | 10.3 (12.5) | 9.5 (11.7) | 8.1 (12.7) | 52 (64) | 9.3 (12.3) |
| A Street/ Fairbanks | 02-090-0040 | 25.4 (35.9) | 27.8 (34.4) | 25.3 (84.2) | 7.1 (8.5) | 7.0 (8.5) | 6.6 (11.1) | 26 (52) | 6.9 (9.4) |
| Floyd Dryden/ Juneau | 02-110-0004 | 16.9 | 15.9 | 22.1 | 4.4 | 4.7 | 4.8 | 18 | 4.6 |
Note: Exceedance exceptional event values not included. Some values in this table have been calculated by DEC to exclude exceptional events. Values in the parentheses exclude only EPA concurred exceptional events. There is no valid design value for Butte in 2024 as the site closed in 2023 and was replaced by the Plant Materials Center monitoring site. The Plant Materials Center began operations in 2024 and will not have a valid design value calculation until three years of complete data have been captured at the site.
†Value did not meet data completeness criteria. This value is preliminary and subject to the maximum value substitution test as outlined in 40 CFR Part 50 Appendix N. Quarters 1-3 (Q1-Q3) for 2022 at the Butte site met the completeness criteria with percent completeness of 96% or greater; however, Butte’s Q4 did not meet the 75% criteria with only 61% completeness. Using the maximum value substitution test (PM2.5 24-hour standard: 40 CFR Part 50 Appendix N, §4.2 (c) (i), and PM2.5 annual standard 40 CFR Part 50 Part 50 Appendix N, § 4.1 (c) (ii)), the max value of Q4 (29.6 µg/m3) for all days with <75% daily data capture.
| O3 Monitoring Sites | Site ID | 2024 Valid Days | 2024 Percent Complete | 2024 4th Max | 2023 Valid Days | 2023 Percent Complete | 2023 4th Max | 2022 Valid Days | 2022 Percent Complete | 2022 Valid Days | 3-Year Percent Complete | 3-Year Design Value |
|---|---|---|---|---|---|---|---|---|---|---|---|---|
| NCore/ Fairbanks | 02-090-0034 | 361 | 99 | 0.052 | 350 | 96 | 0.050 | 350 | 96 | 0.055 | 97 | 0.052 |
*Does not meet data completeness criteria
| SO2 Monitoring Sites | Site ID | 2024 99th Percentile | 2024 Completed Quarters | 2023 99th Percentile | 2023 Completed Quarters | 2022 99th Percentile | 2022 Completed Quarters | 3-Year Design Value |
|---|---|---|---|---|---|---|---|---|
| NCore/ Fairbanks | 02-090-0034 | 11.1 | 4 | 14.7 | 4 | 32.8 | 4 | 20 |
| Hurst Rd/ Fairbanks | 02-090-0035 | 4.9 | 4 | 5.6 | 4 | 8.1* | 3 | 6* |
* Does not meet data completeness criteria
| CO Monitoring Sites | Site ID | 2024 Exceedances | 2024 1st Max 8-hour | 2024 2nd Max 8-hour | 2023 Exceedances | 2023 1st Max 8-hour | 2023 2nd Max 8-hour | 2023 Exceedances | 2023 1st Max 8-hour | 2023 2nd Max 8-hour |
|---|---|---|---|---|---|---|---|---|---|---|
| NCore/ Fairbanks | 02-090-0034 | 0 | 3.2 | 1.9 | 0 | 2.3 | 1.9 | 0 | 2.8 | 2.5 |
| Garden/ Anchorage | 02-020-0018 | 0 | 3.1 | 2.7 | 0 | 2.6 | 2.4 | 0 | 2.5 | 2.4 |
* Does not meet data completeness criteria
| PM10 Monitoring Sites | Site ID | 2024 Exceedances | 2024 1st Max 24-hr | 2024 2nd Max 24-hr | 2023 Exceedances | 2023 1st Max 24-hr | 2023 2nd Max 24-hr | 2022 Exceedances | 2022 1st Max 24-hr | 2022 2nd Max 24-hr |
|---|---|---|---|---|---|---|---|---|---|---|
| Garden/ Anchorage | 02-020-0018 | 0 | 63 | 57 | 0 | 59 | 53 | 0 | 57 | 52 |
| Laurel/ Anchorage | 02-020-0045 | 0 | 134 | 106 | 0 | 95 | 88 | 0 | 103 | 101 |
| Parkgate/ Anchorage | 02-020-1004 | 0 | 54 | 52 | 0 | 59 | 59 | 0 | 77 | 65 |
| NCore/ Fairbanks | 02-090-0034 | 0 | 113 | 90 | 1 | 170 | 138 | 2 | 243 | 171 |
| Butte/ Matanuska-Susitna Valley | 02-170-0008 | NA | NA | NA | 0 | 132 | 130 | 0 | 90 | 76 |
| Plant Materials Center/ Matanuska-Susitna Valley | 02-170-0010 | 0 | 118 | 78 | NA | NA | NA | NA | NA | NA |
| Floyd Dryden Middle School/ Juneau | 02-110-0004 | 0 | 32 | 29 | 0 | 44 | 36 | 0 | 38 | 38 |
*Exceedance exceptional event values not included.
7 Appendix B Map of Alaska’s Core Based Statistical Areas (CBSA)
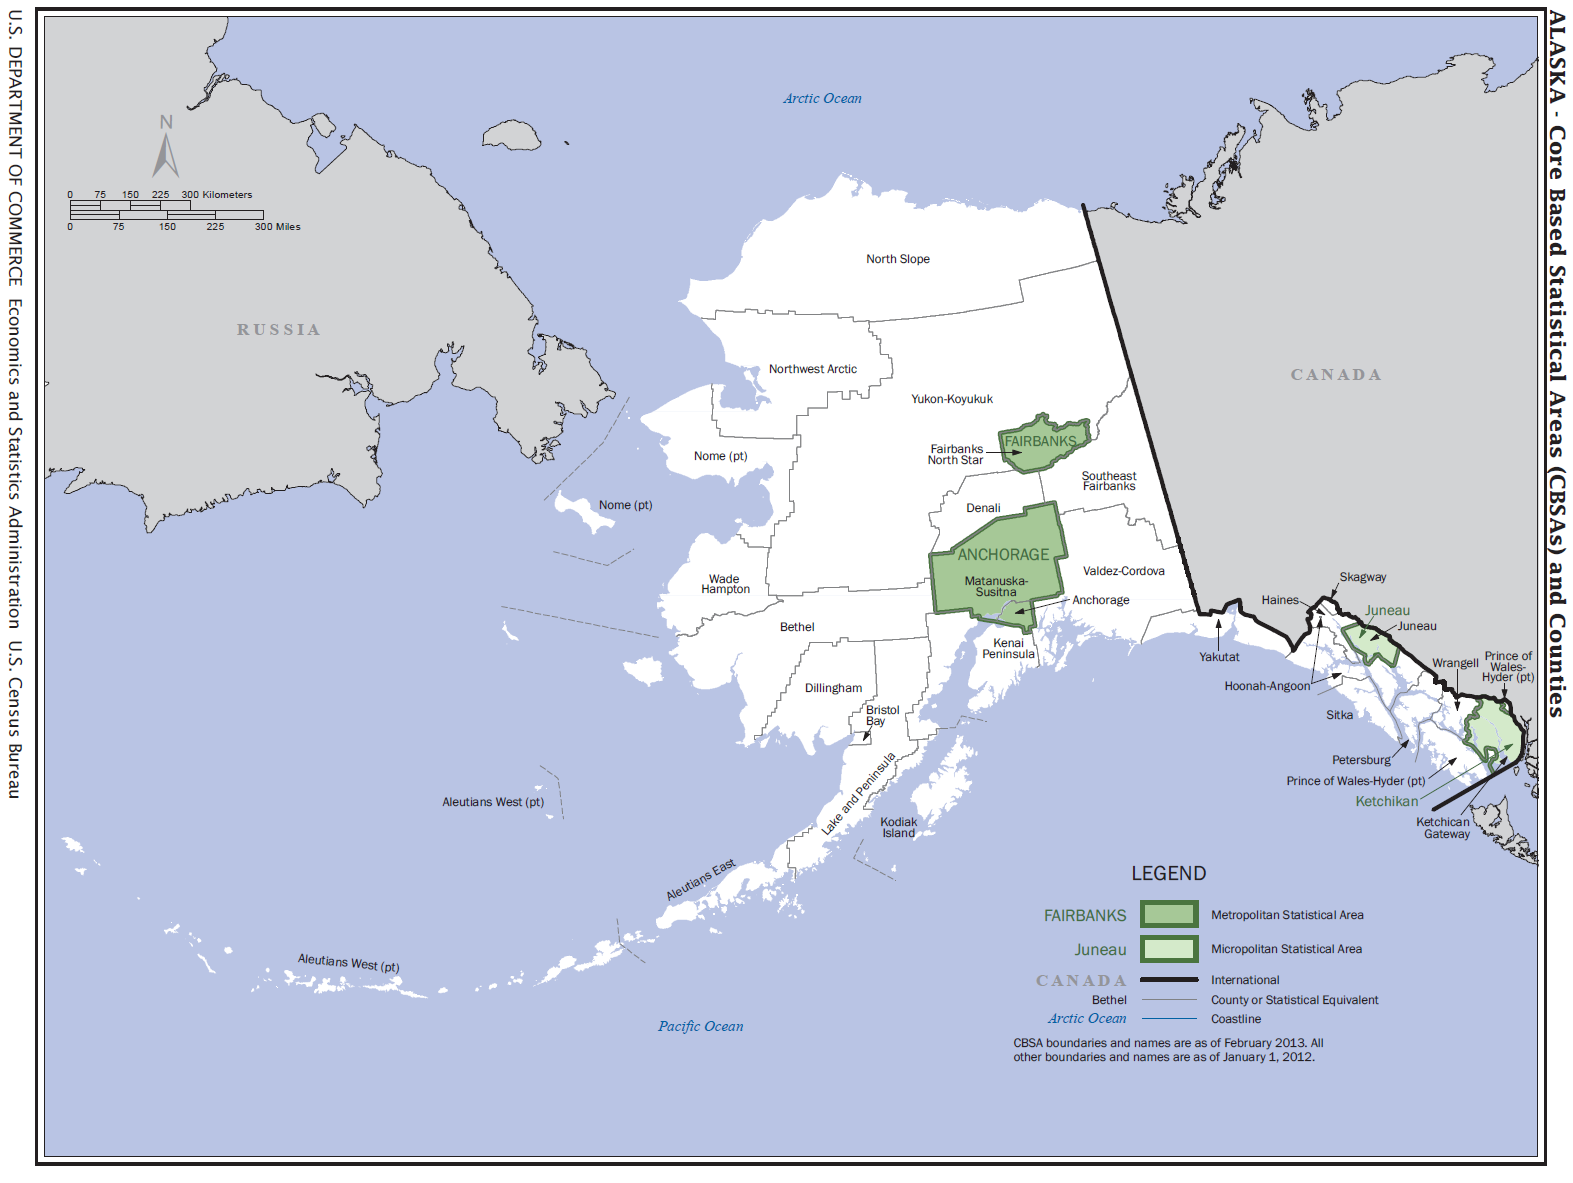
U.S. Census Bureau
8 Appendix C Waivers
Waiver C-1: EPA 5-Year Ozone NAAQS Monitoring Requirement Waiver
9 Appendix D Network Evaluation Forms
Part 58 Appendix D Network Evaluation Form for PM2.5
State: Alaska
Agency: Department of Environmental Conservation
AQS Agency Code: 02
Evaluation Date: 4/15/2024
Evaluator: Rochelle Rodman
| Applicable Section | Requirement | Criteria Met? |
|---|---|---|
| 4.7.1(a) | States, and where applicable local agencies must operate the minimum number of required PM2.5 SLAMS sites listed in Table D-5 of this appendix. Use the form below and Table D-5 to verify if each of your MSAs have the appropriate number of SLAMS FRM/FEM/ARM samplers. | Yes |
| 4.7.1(b) | Each required SLAMS FRM/FEM/ARM monitoring stations or sites must be sited to represent area-wide air quality in the given MSA (typically neighborhood or urban spatial scale, though micro-or middle-scale okay if it represents many such locations throughout the MSA). | Yes |
| 4.7.1(b)(1) | At least one SLAMS FRM/FEM/ARM monitoring station is to be sited at neighborhood or larger scale in an area of expected maximum concentration for each MSA where monitoring is required by 4.7.1(a). | Yes |
| 4.7.1(b)(2) | For CBSAs with a population of 1,000,000 or more persons, at least one FRM/FEM/ARM PM2.5 monitor is to be collocated at a near-road NO2 station. | NA |
| 4.7.1(b)(3) | For MSAs with additional required SLAMS sites, a FRM/FEM/ARM monitoring station is to be sited in an area of poor air quality. | Yes |
| 4.7.2 | Each State must operate continuous PM2.5 analyzers equal to at least one-half (round up) the minimum required sites listed in Table D-5 of this appendix. At least one required continuous analyzer in each MSA must be collocated with one of the required FRM/FEM/ARM monitors, unless at least one of the required FRM/FEM/ARM monitors is itself a continuous FEM or ARM monitor, in which case no collocation requirement applies. | Yes |
| 4.7.3 | Each State shall install and operate at least one PM2.5 site to monitor for regional background and at least one PM2.5 site to monitor regional transport (note locations in comment field). Non-reference PM2.5 monitors such as IMPROVE can be used to meet this requirement. | Yes |
| 4.7.4 | Each State shall continue to conduct chemical speciation monitoring and analyses at sites designated to be part of the PM2.5 Speciation Trends Network (STN). | Yes |
Comments: NA
| MSA population1,2 | Most recent 3-year design value ≥ 85% of any PM2.5 NAAQS3 | Most recent 3-year design value < 85% of any PM2.5 NAAQS3,4 |
|---|---|---|
| >1 million | 3 | 2 |
| 500K to 1 million | 2 | 1 |
| 50K to <500K5 | 1 | 0 |
1 Minimum monitoring requirements apply to the Metropolitan statistical area (MSA).
2 Population based on latest available Census figures. https://www.census.gov/
3 The PM2.5 National Ambient Air Quality Standards (NAAQS) levels and forms are defined in 40 CFR part 50.
4 These minimum monitoring requirements apply in the absence of a design value.
5 Metropolitan statistical areas (MSA) must contain an urbanized area of 50,000 or more population.
| MSA Description1 | MSA population2,3 | Design Value for years 2021-2023 24-hr/Annual Avg. µg/m3 | Minimum required number of PM2.5 SLAMS FRM/FEM/ARM sites (from Table D-5) | Present number of PM2.5 SLAMS FRM/FEM/ARM sites in MSA | Present number of continuous PM2.5 FEM/ARM analyzers in MSA | Present number of continuous PM2.5 STN analyzers in MSA |
|---|---|---|---|---|---|---|
| Anchorage MSA | 407,213 | - | - | - | - | - |
| Municipality of Anchorage | 289,600 | - | 1 | 1 | 0 | - |
| Garden Site | - | 19/5.1 | SLAMS/FRM & FEM | 1 | 1 | 0 |
| Matanuska-Susitna Valley Borough | 117,613 | - | 1 | 0 | 1 | 0 |
| Butte Site | - | 23**/5.0** | SLAMS/FEM | 0 | 1 | 0 |
| Fairbanks North Star Borough MSA | 94,951 | - | 1 | 5 | 3 | 2 speciation |
| A Street | - | 38***/11.5*** | SPM/FRM | 1 | 1 | 0 |
| NCore Site | - | 26/7.3 | NCore/FRM | 1 | 1* | 1 speciation |
| Hurst Rd | - | 56/9.9 | SPM/FRM | 2 | 1* | 1 speciation |
| City and Borough of Juneau µSA | 31,572 | - | 0 | 1 | 1 | 0 |
| Floyd Dryden Site | - | 19/5.1 | SLAMS/FEM & FRM | 1 | 1 | 0 |
2 Minimum monitoring requirements apply to the metropolitan statistical area (MSA). CBSA includes both MSAs and micropolitan statistical areas.
3 Population based on population estimates for July 1, 2023 obtained from the United States Census Bureau, U.S. Census Bureau Alaska Data
* MetOne BAM w/ SCC; per discussion with EPA VSCC cyclone removed
** Maximum value substitutions applied due to data completeness criteria not being met. Substitutions were performed according to the procedures outlined in 40 CFR Part 50 Appendix N, §4.2 (c) (i) and 40 CFR Part 50 Part 50 Appendix N, § 4.1 (c) (ii)).
*** Annual values did not meet data completeness criteria. This value is preliminary and subject to the maximum value substitution test as outlined in 40 CFR Part 50 Appendix N. A Street DVs cannot be officially calculated until 2024 monitoring data has been collected and verified.
Part 58 Appendix D Network Evaluation Form for PM10
State: Alaska
Agency: Department of Environmental Conservation
AQS Agency Code: 02
Evaluation Date: 4/12/2024
Evaluator: Rochelle Rodman
| Applicable Section | Requirement | Criteria Met? |
|---|---|---|
| 4.6(a) | Table D-4 indicates the approximate number of permanent stations required in MSAs to characterize national and regional PM10 air quality trends and geographical patterns. Use the form below and Table D-4 to verify if your PM10 network has the appropriate number of samplers. | Yes |
Comments:
-
All of the site locations are based on historical agreements among the EPA, DEC and (where applicable) local agencies.
-
One exceedance on May 7, 2019 at the Butte site caused the entire Anchorage MSA to be categorized as high concentration. DEC qualified the exceedance day data as RJ (high winds). These one day could be the basis for a 2019 EEWR should EPA request DEC or EPA start another PM10 designation process. Thus DEC assumes that medium concentration is applicable when these exceptional events are excluded from the compliance calculations (Section 6, Table A-5 with assumed EEWRs).
| MSA Description1 | MSA population2,3 | Minimum required number of PM10 stations (from Table D-4) | Present number of PM10 stations in MSA |
|---|---|---|---|
|
Municipality of Anchorage & Matanuska-Susitna Valley Borough (MSA) (combined) |
407,213 |
3-4 (high conc)/ 1-2 (med conc; high winds EE exceedances removed) |
3 SLAMS (1 Collocate) |
| Fairbanks North Star Borough MSA | 94,951 | 0 (low conc) | 1 (NCore, collocated) |
| City and Borough of Juneau µSA | 31,572 | 0 (low conc) | 1 (SLAMS) |
2 Minimum monitoring requirements apply to the Metropolitan statistical area (MSA). CBSA includes both MSAs and micropolitan statistical areas.
3 Population based on population estimates for July 1, 2023 obtained from the United States Census Bureau, U.S. Census Bureau Alaska Data
| MSA population1,2 | High concentration2 | Medium concentration3 | Low concentration4,5 |
|---|---|---|---|
| >1 million | 6-10 | 4-8 | 2-4 |
| 500K to 1 million | 4-8 | 2-4 | 1-2 |
| 250K to 500K | 3-4 | 1-2 | 0-1 |
| 100K to 250K | 1-2 | 0-1 | 0 |
1 Selection of urban areas and actual numbers of stations per area will be jointly determined by EPA and the State agency.
2 High concentration areas are those for which ambient PM10 data show ambient concentrations exceeding the PM10 NAAQS by 20 percent or more.
3 Medium concentration areas are those for which ambient PM10 data show ambient concentrations exceeding 80 percent of the PM10 NAAQS.
4 Low concentration areas are those for which ambient PM10 data show ambient concentrations less than 80 percent of the PM10 NAAQS.
5 These minimum monitoring requirements apply in the absence of a design value.
Part 58 Appendix D Site Evaluation Form for Carbon Monoxide (CO)
State: Alaska
Agency: Department of Environmental Conservation
AQS Agency Code: 02
Evaluation Date: 4/12/2024
Evaluator: Rochelle Rodman
| Applicable Section | Requirement | Criteria Met? |
|---|---|---|
| 4.2.1(a) | One CO monitor is required to operate collocated with one required near-road NO2 monitor in CBSAs having a population of 1,000,000 or more persons. If a CBSA has more than one required near-road NO2 monitor, only one CO monitor is required to be collocated with a near-road NO2 monitor within that CBSA. | NA |
| 4.2.2(a) | Has the EPA Regional Administrator required additional CO monitoring stations above the minimum number of monitors required in 4.2.1? If so, note location in comment field. | Yes |
Comments: The State of Alaska has no CBSA with a population of 1,000,000. Therefore, there are no near-road collocated sites for CO and NO2.The Garden Site (AQS ID 02-020-0018) is the single CO site currently operating in the Municipality of Anchorage for Limited Maintenance Plan compliance. A single CO SLAMS monitor operated for Limited Maintenance Plan compliance in the Fairbanks North Star Borough at the Old Post Office Building site (AQS 02-090-0002) until 4/30/2014. Since then the Fairbanks North Star Borough multi-pollutant NCore site (02-090-0034) currently is the single CO site for compliance with NCore requirements and for Limited Maintenance Plan compliance in Fairbanks.
| MSA Description1 | CBSA population2,3 | Minimum required number of SLAMS CO sites | Present number of SLAMS CO sites in MSA |
|---|---|---|---|
| Municipality of Anchorage & Matanuska-Susitna Valley Borough (MSA) (combined) | 407,213 | 0 | 1* |
| Fairbanks North Star Borough | 94,951 | 0 | 1* |
2 Minimum monitoring requirements apply to the Metropolitan statistical area (MSA). CBSA includes both MSAs and micropolitan statistical areas.
3 Population based on population estimates for July 1, 2023 obtained from the United States Census Bureau, U.S. Census Bureau Alaska Data
* Monitoring sites in both MSAs satisfy their respective CO Limited Maintenance Plans requirements.
Part 58 Appendix D Site Evaluation Form for Ozone (O3)
State: Alaska
Agency: Department of Environmental Conservation
AQS Agency Code: 02
Evaluation Date: 4/12/2024
Evaluator: Rochelle Rodman
| Applicable Section | Requirement | Criteria Met? |
|---|---|---|
| 4.1(b) | At least one O3 site for each MSA, or CSA if multiple MSAs are involved, must be designed to record the maximum concentration (note location in comment field). | Yes |
| 4.1(c) | The appropriate spatial scales for O3 sites are neighborhood, urban, and regional (note deviations in comment field). | Yes |
| 4.1(f) | Confirm that the monitoring agency consulted with EPA R10 when siting the maximum O3 concentration site. | Yes |
| 4.1(i) | O3 is being monitored at SLAMS monitoring sites during the “ozone season” as specified in Table D-3 of Appendix D to Part 58. | Yes |
Comments:
-
DEC received an EPA 5-Year Ozone NAAQS Monitoring Requirement Waiver for the Anchorage MSA (Section 8 Waiver C-1). This waiver was extended to 2028 (Section 8 Waiver C-2). Palmer O3 was discontinued at the end of ozone season 2018.
-
An ozone monitoring site was established in the Fairbanks North Star Borough at the multi-pollutant NCore site (AQS 02-090-0034) in August 2011 and has been operated year-round since then.
| MSA Description1 | MSA population 2,3 | Minimum required number of SLAMS O3 sites (from Table D-2) | Present number of SLAMS O3 sites in CBSA | Notes |
|---|---|---|---|---|
| Municipality of Anchorage & Matanuska-Susitna Valley Borough (MSA) (combined) | 407,213 | 1 | 0 | See EPA ozone waiver link* |
| Fairbanks North Star Borough | 94,951 | 0 | 1** | NCore Site |
2 Minimum monitoring requirements apply to the Metropolitan statistical area (MSA). CBSA includes both MSAs and micropolitan statistical areas.
3 Population based on population estimates for July 1, 2023 obtained from the United States Census Bureau, U.S. Census Bureau Alaska Data
* DEC received an EPA 5-Year Ozone NAAQS Monitoring Requirement Waiver for the Anchorage MSA (Section 8 Waiver C-1), which was extended until 2028 (Section 8 Waiver C-2).
** Fulfills State of Alaska NCore requirement
| MSA population1,2 | Most recent 3-year design value concentrations ≥85% of any O3 NAAQS3 | Most recent 3-year design value concentrations <85% of any O3 NAAQS3,4 |
|---|---|---|
| > 10 million | 4 | 2 |
| 4-10 million | 3 | 1 |
| 350,000 - < 4 million | 2 | 1 |
| 50,000 - < 350,0005 | 1 | 0 |
1 Minimum monitoring requirements apply to the Metropolitan statistical area (MSA). CBSA includes both MSAs and micropolitan statistical areas.
2 Population based on latest available Census estimates.
3 The ozone (O3) National Ambient Air Quality Standards (NAAQS) levels and forms are defined in 40 CFR part 50.
4 These minimum monitoring requirements apply in the absence of a design value.
5 Metropolitan statistical areas (MSA) must contain an urbanized area of 50,000 or more population.
| State | Begin month | End Month |
|---|---|---|
| Alaska | April | October |
| Idaho | May | September |
| Oregon | May | September |
| Washington | May | September |
Part 58 Appendix D Site Evaluation Form for Sulfur Dioxide (SO2)
State: Alaska
Agency: Department of Environmental Conservation
AQS Agency Code: 02
Evaluation Date: 4/12/2024
Evaluator: Rochelle Rodman
| Applicable Section | Requirement | Criteria Met? |
|---|---|---|
| 4.4.1 | State and, where appropriate, local agencies must operate a minimum number of required SO2 monitoring sites (based on PWEI calculation specified in 4.4.2 – use Table 1 and 2 below to determine minimum requirement for each CBSA) | Yes |
| 4.4.2(a)(1) | Is the monitor sited within the boundaries of the parent CBSA and is it one of the following site types: population exposure, highest concentration, source impacts, general background, or regional transport? | NA |
| 4.4.3(a) | Has the EPA Regional Administrator required additional SO2 monitoring stations above the minimum number of monitors required in 4.4.2? If so, note location in comment field. | No |
| 4.4.5(a) | Is your agency counting an existing SO2 monitor at an NCore site in a CBSA with a minimum monitoring requirement? | NA |
Comments: As evident from the calculations shown below, the State of Alaska has no CBSAs which require SO2 monitoring. One of the operating SO2 monitors is located at the multi-pollutant NCore site in the Fairbanks North Star Borough operated for compliance with NCore site requirements. The other SO2 analyzer was added to the Hurst Road site in 2021. This data will be helpful for interpreting the sulfate information gained from the speciation monitor at this site.
| CBSA Description1 | CBSA population2,3 | Total amount of SO2 in tons per year emitted within the CBSA (from 2017 NEI4) | PWEI (population x total emissions ÷ 1,000,000) | Minimum required number of SO2 monitors in CBSA (see Table 42 below) | Present number of SO2 monitors in CBSA |
|---|---|---|---|---|---|
| Anchorage Municipality | 289,600 | 262.0 | 74.9 | 0 | 0 |
| Matanuska-Susitna Borough | 117,613 | 326.4 | 37.6 | 0 | 0 |
| Fairbanks North Star Borough | 94,951 | 6,904.6 | 654.8 | 0 | 2* |
| Juneau City and Borough | 31,572 | 71.7 | 2.3 | 0 | 0 |
| Ketchikan Gateway Borough | 13,677 | 37.5 | 0.5 | 0 | 0 |
2 Minimum monitoring requirements apply to the Metropolitan statistical area (MSA). CBSA includes both MSAs and micropolitan statistical areas.
3 Based on population estimates for July 1, 2024 obtained from the United States Census Bureau, U.S. Census Bureau QuickFacts: Juneau City and Borough (County), Alaska; Fairbanks North Star Borough, Alaska; Matanuska-Susitna Borough, Alaska; Anchorage Municipality (County), Alaska; Alaska
4 see 2020 National Emissions Inventory (NEI) Data | US EPA
* One monitor present to satisfy NCore requirement.
| PWEI (Population weighted Emission Index) Value | Required number of SO2 monitors |
|---|---|
| >= 1,000,000 | 3 |
| >= 100,000 but < 1,000,000 | 2 |
| >= 5,000 but < 100,000 | 1 |
Part 58 Appendix D Site Evaluation Form for Nitrogen Dioxide (NO2)
State: Alaska
Agency: Department of Environmental Conservation
AQS Agency Code: 02
Evaluation Date: 4/15/2024
Evaluator: Rochelle Rodman
| Applicable Section | Requirements | Criteria Met? |
|---|---|---|
| 4.3.2(a) | Near-road NO2 Monitors: One microscale near-road NO2 monitoring station in each CBSA with a population of 1,000,000 or more persons. | NA |
| 4.3.2(a) | Near-road NO2 Monitors: An additional near-road NO2 monitoring station is required for any CBSA with a population of 2,500,000 persons, or in any CBSA with a population of 500,000 or more persons that has one or more roadway segments with 250,000 or greater annual ADT count. | NA |
| 4.3.2(b) | Near-road NO2 Monitors: Measurements at required near-road NO2 monitor sites utilizing chemiluminescence FRMs must include at a minimum: NO, NO2, and NOx | NA |
| 4.3.3(a) | Area-wide NO2 Monitoring: One monitoring station in each CBSA with a population of 1,000,000 or more persons to monitor a location of expected highest NO2 concentrations representing the neighborhood or larger spatial scales. | NA |
Comments: The State of Alaska has no CBSA with a population of 1,000,000. The Fairbanks North Star Borough is currently analyzing for NO, NOy, and Difference, which satisfies the NCore requirement for NO2.
| CBSA Description1 | CBSA population2,3 | Required number of Near-road NO2 sites | Present number of Near-road NO2 sites | Required number of Area-wide NO2 sites | Present number of Area-wide NO2 sites |
|---|---|---|---|---|---|
| Municipality of Anchorage & Matanuska-Susitna Valley Borough (MSA) (combined) | 407,213 | 0 | 0 | 0 | 0 |
| Fairbanks North Star Borough (MSA) | 94,951 | 0 | 0 | 0 | 0* |
| City and Borough of Juneau (µSA) | 31,572 | 0 | 0 | 0 | 0 |
2 Minimum monitoring requirements apply to the Metropolitan statistical area (MSA). CBSA includes both MSAs and micropolitan statistical areas.
3 Population based on population estimates for July 1, 2023 obtained from the United States Census Bureau, U.S. Census Bureau Alaska Data
* NCore site requirement is satisfied with NOy monitoring
10 Appendix E Summary of Monitoring Path & Siting Criteria Evaluation Forms
| - | Garden | Parkgate | Laurel1 | PMC | Hurst Road | A Street | NCore | Floyd Dryden |
|---|---|---|---|---|---|---|---|---|
| Parameter(s) | PM2.5 & PM10 | PM10 | PM10 | PM2.5 & PM10 | PM2.5 | PM2.5 | PM2.5, PM10 & PM10-2.5 | PM2.5 & PM10 |
| Address | 3000 E 16th Ave, Anchorage | 11723 Old Glenn Hwy, Eagle River | 4335 Laurel St, Anchorage | 5310 Bodenburg Spur Rd., Palmer | 3288 Hurst Rd, North Pole | 397 Hamilton Ave, Fairbanks | 907 Terminal St., Fairbanks | 3800 Mendenhall Loop Rd., Juneau |
| AQS ID | 02-020-0018 | 02-020-1004 | 02-020-0045 | 02-170-0010 | 02-090-0035 | 02-090-0040 | 02-090-0034 | 02-110-0004 |
| 2. HORIZONTAL AND VERTICAL PLACEMENT | Criteria met, 11 m | Criteria met, 10 m | Criteria met, 6 m |
Criteria met, 4.3 m |
Criteria met, 4 m | Criteria met, 4 m | Criteria met, 4 m |
Criteria met, 7 m |
| 3. SPACING FROM MINOR SOURCES (a) | Criteria met, chimney 3.8 m away | Criteria met, paved parking lot >10 m away | Criteria met, max impact site, winter graveled streets |
Criteria met, 17 m from gravel road |
Criteria met | Criteria met, near a school and a neighborhood | Criteria met, ~ 260 m to Aurora Wood Processing2, ~400 m to power plant3 | Criteria met, ~15 to kitchen vent, ~20 m to furnace flue |
| 4. SPACING FROM OBSTRUCTIONS (a) | Criteria met, unrestricted | Criteria met, unrestricted | Criteria met, unrestricted | Criteria met, unrestricted | Criteria met, unrestricted | Criteria met, unrestricted | Criteria met, unrestricted | Criteria met, unrestricted |
| 4. SPACING FROM OBSTRUCTIONS (b) | Criteria met, unrestricted | Criteria met, unrestricted | Criteria met, unrestricted |
Criteria met, >20 m to nearest building |
Criteria met, unrestricted | Criteria met, unrestricted | Criteria met, unrestricted | Criteria met, ~8 m to Hi-Vol RadNet Monitor |
| 5. SPACING FROM TREES (a) | Criteria met, >10 m | Criteria met, >10 m | Criteria met, >20 m |
Criteria met, >40 m |
Criteria met, >10 m | Criteria met, >10 m | Criteria met, >10 m |
Criteria met, >20 m |
| 5. SPACING FROM TREES (c)* | NA | NA | Criteria met | NA | NA | NA | NA | NA |
| 6. SPACING FROM ROADWAYS | Criteria met, >10 m to road | Criteria met, >25 m to paved roads | Criteria met, 11 m to road, maximum exposure site | Criteria met, >10 m to road | Criteria met, >20 m to road | Criteria not met, <10 m to road4 | Criteria met, 10 m to road | Criteria met, ~100 m to road |
| Changes that might compromise siting?5 | No | No | No | No | No | No | No | No |
1 Laurel is the only microscale site in Alaska’s PM network
2 Aurora Energy Solutions is a wood processing and kiln drying operation which began approximately in 2020.
3 Coal power plant stack emits emissions above and outside of ground-surface monitoring. No observed bias upon the collection of Air Quality data.
4 This site is located on a low-volume roadway that is paved and covered with snow and ice for six months of the year.
5 All sites are in compliance with groundcover criteria.
| - | Garden | NCore |
|---|---|---|
| Parameter(s) | CO | CO |
| Address | 3000 E 16th Ave, Anchorage | 907 Terminal St., Fairbanks |
| AQS ID | 02-020-0018 | 02-090-0034 |
| 2. HORIZONTAL AND VERTICAL PLACEMENT | Criteria met, 2.6 m | Criteria met, 3 m |
| 3. SPACING FROM MINOR SOURCES | Criteria met, residential | Criteria met, ~260 m to Aurora Wood Processing1, ~400 m to coal power plant2 |
| 4. SPACING FROM OBSTRUCTIONS (a) | Criteria met, no obstacles | Criteria met, no obstacles |
| 4. SPACING FROM OBSTRUCTIONS (b) | Criteria met, 180o | Criteria met, unrestricted |
| 5. SPACING FROM TREES (a) | Criteria met, although there is a tree 2.7 m NE of probe, but airflow is still available around and through the tree | Criteria met |
| 5. SPACING FROM TREES (c) | NA | NA |
| 6. SPACING FROM ROADWAYS | NA, Neighborhood scale but 7.6 m from roadway3 | NA, Neighborhood scale but 85 m from roadway |
| 9. PROBE MATERIAL & RESIDENCE TIME (a) | FEP Teflon | Glass w/ FEP sample lines |
| 9. PROBE MATERIAL & RESIDENCE TIME (c) | Criteria met, < 20 seconds | Criteria met, < 20 seconds |
| Changes that might compromise siting?4 | No | No |
1 Aurora Energy Solutions is a wood processing and kiln drying operation which began in approximately 2020.
2 Coal power plant stack emits emissions above and outside of ground-surface monitoring.
3 This site was originally set up as a microscale site by the Municipality of Anchorage which would
4 All sites are in compliance with groundcover criteria.
| - | NCore | NCore | NCore | Hurst Road |
|---|---|---|---|---|
| Site / Parameter(s) | O3 | SO2 | NO, Diff, & NOy | SO2 |
| AQS ID | 02-090-0034 | 02-090-0034 | 02-090-0034 | 02-090-0035 |
| Address | 907 Terminal St., Fairbanks | 907 Terminal St., Fairbanks | 907 Terminal St., Fairbanks | 3288 Hurst Rd, North Pole |
| 2. HORIZONTAL AND VERTICAL PLACEMENT | Criteria met, 3 m | Criteria met, 3 m | Criteria met, 3 m | Criteria met, 3 m |
| 3. SPACING FROM MINOR SOURCES | Criteria met, ~ 260 m to Aurora Wood Processing1, ~400 m to power plant2 | Criteria met, ~ 260 m to Aurora Wood Processing1, ~400 m to power plant2 | Criteria met, ~ 260 m to Aurora Wood Processing1, ~400 m to power plant2 | Criteria met |
| 3. SPACING FROM MINOR SOURCES (b) | Criteria met, no furnaces/flues | - | - | - |
| 4. SPACING FROM OBSTRUCTIONS (a) | Criteria met, no obstacles | Criteria met, no obstacles | Criteria met, no obstacles | Criteria met, no obstacles |
| 4. SPACING FROM OBSTRUCTIONS (b) |
Criteria met, unrestricted 360o airflow |
Criteria met, unrestricted 360o airflow |
Criteria met, unrestricted 360o airflow |
Criteria met, unrestricted 360o airflow |
| 4. SPACING FROM OBSTRUCTIONS (d) | - | - | NA | - |
| 5. SPACING FROM TREES (a) | Criteria met, >10 m | Criteria met, > 10 m | Criteria met, >10 m | Criteria met, >10 m |
| 5. SPACING FROM TREES (c) | NA | NA | NA | NA |
| 6. SPACING FROM ROADWAYS | Criteria met, >10 m to road | NA | Criteria met, >10 m to road | |
| 9. PROBE MATERIAL & RESIDENCE TIME (a) | Borosilicate glass w/ FEP Teflon sample lines | Borosilicate glass w/ FEP Teflon sample lines | Borosilicate glass w/ FEP Teflon sample lines | FEP Teflon sample lines |
| 9. PROBE MATERIAL & RESIDENCE TIME (c) | < 5 seconds | < 5 seconds | < 20 seconds | Not an NCore site, < 20 seconds |
| Changes that might compromise siting?3 | No | No | No | No |
1 Aurora Energy Solutions is a wood processing and kiln drying operation which began approximately in 2020.
2 Coal power plant stack emits emissions above and outside of ground-surface monitoring. No observed bias upon the collection of Air Quality data.
3 All sites are in compliance with groundcover criteria.
Blank Part 58 Appendix E Site Evaluation Form for PM2.5, PM10, PM10-2.5, and Pb
Site Name:
Site Address:
AQS ID:
Evaluation Date:
Evaluator:
| Applicable Section | Requirement | Observed | Criteria Met? (yes, no, NA) |
|---|---|---|---|
| HORIZONTAL AND VERTICAL PLACEMENT | 2-15 meters above ground level for neighborhood or larger spatial scale, 2-7 meters for microscale spatial scale sites and middle spatial scale PM10-2.5 sties. 1 meter vertically or horizontally away from any supporting structure, walls, etc.,and away from dusty or dirty areas. If located near the side of a building or wall, then locate on the windward side relative to the prevailing wind direction during the season of highest concentration potential. | - | - |
| SPACING FROM MINOR SOURCES | (a) For neighborhood or larger spatial scales avoid placing the monitor near local, minor sources. The source plume should not be allowed to inappropriately impact the air quality data collected at a site. Particulate matter sites should not be located in an unpaved area unless there is vegetative ground cover year-round. | - | - |
| SPACING FROM OBSTRUCTIONS |
(a) To avoid scavenging, the inlet must have unrestricted airflow and be located away from obstacles. The separation distance must be at least twice the height that the obstacle protrudes above the probe inlet. (b) The inlet must have unrestricted airflow in an arc of at least 180 degrees. This arc must include the predominant wind direction for the season of greatest pollutant concentration potential. For particle sampling, a minimum of 2 meters of separation from walls, parapets, and structures is required for rooftop site placement. |
- | - |
| SPACING FROM TREES | (a) To reduce possible interference the inlet must be at least 10 meters or further from the drip line of trees. | - | - |
| SPACING FROM ROADWAYS | Spacing from roadways is dependent on the spatial scale and ADT count. See section 6.3(b) and figure E-1 for specific requirements. | - | - |
| - | Are there any changes that might compromise original siting criteria? | - | - |
Other comments:
Blank Part 58 Appendix E Site Evaluation Form for CO
Site Name:
Site Address:
AQS ID:
Evaluation Date:
Evaluator:
| Applicable Section | Requirement | Observed | Criteria Met? (yes, no, NA) |
|---|---|---|---|
| HORIZONTAL AND VERTICAL PLACEMENT | For neighborhood or larger spatial scale sites the probe must be located 2-15 meters above ground level and must be at least 1 meter vertically or horizontally away from any supporting structure, walls, etc.,and away from dusty or dirty areas. If located near the side of a building or wall, then locate on the windward side relative to the prevailing wind direction during the season of highest concentration potential. | - | - |
| SPACING FROM MINOR SOURCES | (a) For neighborhood scale avoid placing the monitor probe inlet near local, minor sources. The source plume should not be allowed to inappropriately impact the air quality data collected at a site. | - | - |
| SPACING FROM OBSTRUCTIONS |
(a) To avoid scavenging, the probe inlet must have unrestricted airflow and be located away from obstacles. The separation distance must be at least twice the height that the obstacle protrudes above the probe inlet (exception is street canyon or source-oriented sites where buildings and other structures are unavoidable). (b) The probe inlet must have unrestricted airflow in an arc of at least 180 degrees. This arc must include the predominant wind direction for the season of greatest pollutant concentration potential. |
- | - |
| SPACING FROM TREES |
(a) To reduce possible interference the probe inlet must be at least 10 meters or further from the drip line of trees. (c) No trees should be between source and probe inlet for microscale sites. |
- | - |
| SPACING FROM ROADWAYS |
2. (b) Microscale CO monitor probes in downtown areas or urban street canyon locations shall be located a minimum distance of 2 meters and a maximum distance of 10 meters from the edge of the nearest traffic lane. 2. (c) Microscale CO monitor inlet probes in downtown areas or urban street canyon locations shall be located at least 10 meters from an intersection and preferably at a midblock location. |
- | - |
| PROBE MATERIAL & RESIDENCE TIME |
(a) Sampling train material must be FEP Teflon or borosilicate glass (e.g., Pyrex) for reactive gases. (c) Sampling probes for reactive gas monitors at NCore must have a sample residence time less than 20 seconds. |
- | - |
| - | Are there any changes that might compromise original siting criteria? If so, provide detail in comment section. | - | - |
1 Distance from the edge of the nearest traffic lane. The distance for intermediate traffic counts should be interpolated from the table values based on the actual traffic count.
Other comments:
Blank Part 58 Appendix E Site Evaluation Form for O3
Site Name:
Site Address:
AQS ID:
Evaluation Date:
Evaluator:
| Applicable Section | Requirement | Observed | Criteria Met? (yes, no, NA) |
|---|---|---|---|
| HORIZONTAL AND VERTICAL PLACEMENT | 2-15 meters above ground level. 1 meter vertically or horizontally away from any supporting structure, walls, etc., and away from dusty or dirty areas. If located near the side of a building or wall, then locate on the windward side relative to the prevailing wind direction during the season of highest concentration potential. | - | - |
| SPACING FROM MINOR SOURCES |
(a) For neighborhood scale avoid placing the monitor probe inlet near local, minor sources. The source plume should not be allowed to inappropriately impact the air quality data collected at a site. (b) To minimize scavenging effects, the probe inlet must be away from furnace or incineration flues or other minor sources of SO2 or NO. |
- | - |
| SPACING FROM OBSTRUCTIONS |
(a) To avoid scavenging, the probe inlet must have unrestricted airflow and be located away from obstacles. The separation distance must be at least twice the height that the obstacle protrudes above the probe inlet. (b) The probe inlet must have unrestricted airflow in an arc of at least 180 degrees. This arc must include the predominant wind direction for the season of greatest pollutant concentration potential. |
- | - |
| SPACING FROM TREES |
(a) To reduce possible interference the probe inlet must be at least 10 meters or further from the drip line of trees. (c) No trees should be between source and probe inlet for microscale sites. |
- | - |
| SPACING FROM ROADWAYS | See spacing requirements table Table 53 | - | - |
| PROBE MATERIAL & RESIDENCE TIME |
(a) Sampling train material must be FEP Teflon or borosilicate glass (e.g., Pyrex). (c) Sampling probes for reactive gas monitors at NCore must have a sample residence time less than 20 seconds. |
- | - |
| - | Are there any changes that might compromise original siting criteria? If so, provide detail in comment section. | - | - |
1 Distance from the edge of the nearest traffic lane. The distance for intermediate traffic counts should be interpolated from the table values based on the actual traffic count.
2 Applicable for ozone monitors whose placement has not already been approved as of December 18, 2006.
Other comments:
Blank Part 58 Appendix E Site Evaluation Form for SO2
Site Name:
Site Address:
AQS ID:
Evaluation Date:
Evaluator:
| Applicable Section | Requirement | Observed | Criteria Met? (yes, no, NA) |
|---|---|---|---|
| HORIZONTAL AND VERTICAL PLACEMENT | 2-15 meters above ground level. 1 meter vertically or horizontally away from any supporting structure, walls, etc.,and away from dusty or dirty areas. If located near the side of a building or wall, then locate on the windward side relative to the prevailing wind direction during the season of highest concentration potential. | - | - |
| SPACING FROM MINOR SOURCES | (a) For neighborhood scale avoid placing the monitor probe inlet near local, minor sources. The source plume should not be allowed to inappropriately impact the air quality data collected at a site. | - | - |
| SPACING FROM OBSTRUCTIONS |
(a) To avoid scavenging, the probe inlet must have unrestricted airflow and be located away from obstacles. The separation distance must be at least twice the height that the obstacle protrudes above the probe inlet. (b) The probe inlet must have unrestricted airflow in an arc of at least 180 degrees. This arc must include the predominant wind direction for the season of greatest pollutant concentration potential. |
- | - |
| SPACING FROM TREES |
(a) To reduce possible interference the probe inlet must be at least 10 meters or further from the drip line of trees. (c) No trees should be between source and probe inlet for microscale sites. |
- | - |
| SPACING FROM ROADWAYS | There are no roadway spacing requirements for SO2. | - | - |
| PROBE MATERIAL & RESIDENCE TIME |
(a) Sampling train material must be FEP Teflon or borosilicate glass (e.g., Pyrex). (c) Sampling probes for reactive gas monitors at NCore must have a sample residence time less than 20 seconds. |
- | - |
| - | Are there any changes that might compromise original siting criteria? If so, provide detail in comment section. | - | - |
Other comments:
Blank Part 58 Appendix E Site Evaluation Form for NO, NOx, NO2, NOy
Site Name:
Site Address:
AQS ID:
Evaluation Date:
Evaluator:
| Applicable Section | Requirement | Observed | Criteria Met? (yes, no, NA) |
|---|---|---|---|
| HORIZONTAL AND VERTICAL PLACEMENT | For neighborhood or larger spatial scale sites the probe must be located 2-15 meters above ground level and must be at least 1 meter vertically or horizontally away from any supporting structure, walls, etc.,and away from dusty or dirty areas. Microscale near-road NO2 monitoring sites are required to have sampler inlets between 2 and 7 meters above ground level. If located near the side of a building or wall, then locate the sampler probe on the windward side relative to the prevailing wind direction during the season of highest concentration potential. | - | - |
| SPACING FROM MINOR SOURCES | (a) For neighborhood scale and larger avoid placing the monitor probe inlet near local, minor sources. The source plume should not be allowed to inappropriately impact the air quality data collected at a site. | - | - |
| SPACING FROM OBSTRUCTIONS |
(a) To avoid scavenging, the probe inlet must have unrestricted airflow and be located away from obstacles. The separation distance must be at least twice the height that the obstacle protrudes above the probe inlet. (b) The probe inlet must have unrestricted airflow in an arc of at least 180 degrees. This arc must include the predominant wind direction for the season of greatest pollutant concentration potential. (d) For near-road NO2 monitoring stations, the monitor probe shall have an unobstructed air flow, where no obstacles exist at or above the height of the monitor probe, between the monitor probe and the outside nearest edge of the traffic lanes of the target road segment. |
- | - |
| SPACING FROM TREES |
(a) To reduce possible interference the probe inlet must be at least 10 meters or further from the drip line of trees. (c) No trees should be between source and probe inlet for microscale sites. |
- | - |
| SPACING FROM ROADWAYS | See spacing requirements table Table 53 | - | - |
| PROBE MATERIAL & RESIDENCE TIME |
(a) Sampling train material must be FEP Teflon or borosilicate glass (e.g., Pyrex). (c) Sampling probes for reactive gas monitors at NCore and at NO2 sites must have a sample residence time less than 20 seconds. |
- | - |
| - | Are there any changes that might compromise original siting criteria? If so, provide detail in comment section. | - | - |
Other comments:
| Roadway average daily traffic, vehicles per day | Minimum distance1 (meters) |
|---|---|
| ≤10,000 | 10 |
| 15,000 | 25 |
| 20,000 | 45 |
| 30,000 | 80 |
| 40,000 | 115 |
| 50,000 | 135 |
| ≥60,000 | 150 |
11 Appendix F Additional Monitoring Projects
SMOKE MONITORING FOR AIR QUALITY ADVISORIES
Wildland fire smoke is a recurring and significant air quality concern in Alaska, often impacting both nearby and distant communities during the summer months. Large wildfires can degrade air quality to unhealthy or hazardous levels, posing a risk to public health – especially for sensitive groups such as children, the elderly, and individuals with respiratory or heart conditions.
The DEC collaborates closely with the Alaska Fire Service, the Alaska Wildland Fire Coordinating Group, and other partners to assess and communicate air quality impacts from wildland fires. Air quality advisories are issued statewide using two primary methods:
-
Continuous monitoring data from regulatory and low-cost sensor networks (where available)
-
Visibility assessments in areas lacking real-time monitoring coverage.
During the 2025 wildfire season, the DEC will continue to partner with other agencies to expand the deployment of low-cost sensors in affected areas as needed. The DEC meteorologist or air quality staff, with support from the National Weather Service (NWS), use meteorological models and air monitoring data to forecast smoke movement and predict areas at risk for poor air quality. Real-time air quality data, advisories, and forecasts are made available to the public through DEC’s website and partner platforms.
In addition to wildfire response, prescribed burns are conducted in collaboration with the Alaska Division of Forestry & Fire Protection and the Alaska Department of Fish & Game to manage fuels and enhance wildlife habitat. Air quality is monitored before and during these operations to minimize impacts on residents and sensitive areas. Public notices are issued if smoke is expected to affect communities, and air quality monitors are strategically placed to track particulate levels and support timely community notifications.
VOLCANIC ASH MONITORING
Alaska’s active volcanoes can produce ash clouds that impact air quality and public health. In the event of a volcanic eruption, the DEC coordinates with the Alaska Volcano Observatory to monitor ash concentrations. A PM10 Met One E-BAM equipped with an AIRSIS communication system is deployed to provide near real-time data, enabling the DEC meteorologist to issue timely air quality advisories for affected regions.
RADIATION MONITORING
The DEC operates three RadNet radiation monitoring sites in Anchorage, Fairbanks, and Juneau as part of the national network. In August 2021, the Anchorage RadNet monitor was relocated from the Alaska State Public Health Laboratory (5455 Doctor MLK Jr. Avenue) to the Garden site (3000 E 16th Avenue), and operational responsibility was transferred to the DEC Air Quality Division. The DEC now manages RadNet equipment at all three sites, ensuring continuous monitoring for radiological events that could impact Alaskan communities.
12 Appendix G Improve Network
The Alaska Regional Haze State Implementation Plan (SIP) includes a comprehensive monitoring strategy to measure, estimate, and characterize air quality and visibility impairment at Alaska’s four federally designated Class I areas: Denali National Park and Preserve, Tuxedni Wilderness Area, Simeonof Wilderness Area, and the Bering Sea Wilderness Area. These areas, established under the 1977 Clean Air Act Amendments, are protected for their exceptional natural visibility and air quality.
To support the SIP and meet the requirements of the federal Regional Haze Rule, Alaska participates in the national IMPROVE (Interagency Monitoring of Protected Visual Environments) network. The IMPROVE program provides long-term, speciated particulate monitoring to assess visibility impairment and track progress toward natural visibility conditions. Alaska currently operates four IMPROVE monitoring stations, representing three of the four Class I areas. Monitors are deployed at Denali National Park and Preserve, Tuxedni Wilderness Area, and Simeonof Wilderness Area specifically to meet Regional Haze Rule requirements. Due to its extreme remoteness, there is no air monitoring at the Bering Sea Wilderness Area.
Data from these IMPROVE sites are critical for evaluating visibility trends, identifying pollutant sources, and demonstrating progress toward the SIP’s goals. Alaska’s SIP requires showing improvement in visibility on the 20% most impaired days, while ensuring no degradation on the 20% clearest days, as part of the long-term national goal to restore natural visibility conditions by 2064.
Monitoring site details and additional information about Alaska’s Regional Haze program are available on the DEC’s Regional Haze website (http://dec.alaska.gov/air/anpms/regional-haze). IMPROVE monitoring data and site information can also be accessed through the EPA’s IMPROVE program portal website (http://vista.cira.colostate.edu/improve).
Footnotes
-
based on population estimates for July 1, 2024, obtained from the United States Census Bureau https://bit.ly/4eJQT1q↩︎
-
EPA 5-Year Ozone NAAQS Monitoring Requirement Waiver (see Section 8, Waiver C-1)↩︎
-
The NCore site address has been updated, but the location has not changed.↩︎
-
Hurst Road is the new name for the North Pole Fire Station #3 site. It was changed in 2018 at Fairbanks North Star Borough’s request.↩︎
-
One spruce tree 7.6 m tall and 1.3 m from the building. It is roughly 2.3 m to the northeast of the CO probe↩︎
-
Average annual traffic count 2023 traffic data accessed at: https://alaskatrafficdata.drakewell.com/publicmultinodemap.asp↩︎
-
Tudor Road between Piper St. & Thorne Pl.↩︎
-
Old Glenn Hwy between Easy St. & Hanson Dr.↩︎
-
Site is <10m from adjacent A-Street, a paved, low traffic neighborhood street, remainder of site grass covered.↩︎
-
Traffic count is listed for Hamilton Ave and Farewell Ave (ADOTPF Site ID #31280070) to be consistent with prior ANP reporting. However, the streets to the north and south of A-Street, Craig Ave and Eureka Ave respectively, have traffic counts of 90 and 100. See Section 3.5.4.↩︎
-
Probe height is 3 meters rather than the 10 meters recommended to remain below the unusually low winter inversion layer.↩︎
-
2023 Philips Field Rd traffic data accessed at: https://alaskatrafficdata.drakewell.com/publicmultinodemap.asp↩︎
-
https://www.epa.gov/amtic/sampling-schedule-calendar↩︎
-
STD = standard conditions of temperature and pressure; LC = local (actual) conditions of temperature and pressure↩︎
-
Meteorological parameters (WS and WD) also measured in scalar.↩︎
-
Multiple AQS codes are used to identify individual chemical species.↩︎
-
Meteorological parameters (WS and WD) also measured in scalar.↩︎
-
https://dec.alaska.gov/air/air-monitoring/guidance/waivers/↩︎
-
https://dec.alaska.gov/air/air-monitoring/responsibilities/database-management/alaska-air-quality-real-time-data/↩︎
 Indicates an external site.