State of Alaska 2025 Ambient Air Quality Network Assessment
Air Quality Division Air Monitoring & Quality Assurance Program
Executive Summary
The U.S. Environmental Protection Agency (EPA) requires state monitoring agencies to conduct a network assessment once every five years [40 CFR 58.10(d)]. The network assessment includes re-evaluation of the objectives and budget for air monitoring, an evaluation of a network’s effectiveness and efficiency, recommendations for network reconfiguration, new technologies, and improvements.
The Air Monitoring and Quality Assurance Program (AMQA) in the Department of Environmental Conservation’s (DEC) Air Quality Division is responsible for planning and overseeing the State’s monitoring network. The monitoring network focuses on criteria pollutants as prescribed by the Clean Air Act. The current primary pollutants of concern in Alaska are fine particulate matter (PM2.5) and coarse particulate matter (PM10), followed in order of importance by carbon monoxide (CO), lead (Pb), ozone (O3), sulfur dioxide (SO2), and nitrogen dioxide (NO2).
Air monitoring has historically focused on Alaska’s largest population centers: the Municipality of Anchorage and Matanuska Susitna (Mat-Su Borough, the Fairbanks North Star Borough (FNSB), and the City and Borough of Juneau. This is also where the regulatory monitoring sites have been established. Due to stagnant or decreasing funding for air quality assessments over the past ten years, the program has had to reduce the monitoring to the required regulatory sites based on EPA requirements for Core Based Statistical Areas (CBSAs). All air quality monitoring efforts statewide, except for tribal community or citizen science monitoring, regional haze (IMPROVE) monitoring, and industry monitoring for permit applications, are conducted by the State’s AMQA program, consisting of 18 positions.
Alaska’s ambient air quality issues focus on particulate matter. Almost every community in the state can be impacted by wildland fire smoke during the summer and road dust from gravel roads or other windblown dust. While other pollutants are also emitted into the atmosphere, the combination of comparatively small population centers, small number of stationary sources, the location and density of industries, and the lack of sunlight to cause pollutant formation, result in lower concerns for the other criteria pollutants.
The current regulatory monitoring network consists of eight sites with 26 monitors. There are three sites, each in the Fairbanks North Star Borough and the Municipality of Anchorage, and one site in each of the Mat-Su Borough and the City and Borough of Juneau.
Monitoring Objectives and Budget
Most of the DEC’s air monitoring activities are focused on population centers and areas that have shown in the past to have air quality problems. The state’s regulatory air monitoring network has remained mostly consistent over the past five years, reducing in scope by one monitoring site in Bethel, Alaska, due in part to the logistics required to support the site during the COVID-19 period. The current statewide ambient air monitoring network now consists only of required regulatory sites and a wider reaching community-based air monitoring sensor network consisting of more affordable non-regulatory sensor pods measuring a variety of pollutants. While EPA funding has mostly remained flat over the years, failure to increase funding due to inflationary concerns results in a net loss, year over year. In January of 2020, one hundred dollars ($100) had the same buying power as one hundred twenty-two dollars ($122) does in December of 20241. These inflationary market shifts greatly strain the ability of air quality agencies to operate their networks effectively.
Network Effectiveness and Efficiency
While the monitoring network meets the regulatory requirement in terms of number of monitoring stations and monitored pollutants, it is confined largely to the population centers and does not adequately characterize conditions in outlying and rural communities.
DEC continues to focus on maintaining the core monitoring site operations and reporting data to the federal air quality database, Air Quality System (AQS). Any additional special studies, special projects, widespread monitoring in smaller communities or emergency monitoring for wildfires or volcanic eruptions proceed when staff time and funding allow.
New sensor technology continues to evolve and improve, providing DEC with cost effective ways to expand monitoring into rural communities and investigate localized issues. These technologies are seeing increased private use and DEC continually receives public requests for information regarding the use and comparison of these sensor pods to data collected at the regulatory monitoring sites. As a seasonal particulate matter monitoring network statewide is needed for natural events such as wildland fire smoke, opportunities continue to grow with the lower cost sensor technology.
Recommendations for Network Reconfiguration and Improvements
Based on the overall low number of industrial sources in the state and the low levels of man-made ambient pollution, DEC does not plan to expand the regulatory monitoring network. Regulatory monitoring stations are expensive and labor intensive.
Throughout the State there are only a few communities with populations between 1,000 and 10,000. These communities are often hub communities, i.e. regional transportation hubs that are served by larger commercial airlines and are jump off points to the smaller communities serviced either by smaller commercial airlines or private transport. Approximately one third of Alaska’s population lives in small rural communities consisting of less than 1,000 residents.
Community Based Monitoring
Beginning in 2019, DEC launched the Community-Based Air Monitoring project, deploying low-cost sensors pods across the state. The sensor network is designed to provide real-time air quality data and trend information, empowering community members to better understand baseline air quality in their areas. While the data collected is non-regulatory, it is available to the public upon request and is displayed in near real time on DEC’s website. DEC currently employs the QuantAQ ModulairTM sensor, which measure particulate matter (PM2.5 and PM10), carbon monoxide, nitric oxide, nitrogen dioxide, ozone, temperature, and relative humidity. As of 2025, DEC has a fleet of 55 QuantAQ ModulairTM sensor pods.
Source Specific Monitoring
Wildland Fire Smoke
As predictions for more frequent and severe fire seasons increase, a stable and long term seasonal or year-round monitoring network is needed to better inform the affected public and aid in smoke forecasting. DEC intends to continue building out the Community-Based Air Monitoring network to serve as a wildland fire smoke network. Many areas of Alaska do not have cellular coverage or cell service that is compatible with the current QuantAQ ModulairTM sensors. DEC is researching and testing Wi-Fi capable sensors that will be deployed into areas that are lacking cellular coverage to increase sensor coverage throughout the state.
Air Toxics program
DEC previously operated an air toxics program, which was discontinued in the early 2000s due to budget cuts. Since then, some short-term studies have been undertaken in various areas, and a few air toxic pollutants remain of concern in Alaska’s largest municipality. In late 2023, DEC submitted a grant application for Inflation Reduction Act (IRA) funds to support the establishment of a National Air Toxics Trends Station (NATTS) in Alaska. The funding was awarded by EPA in the spring of 2025. DEC will begin sampling air toxics in January of 2026 at the Hurst Road air monitoring station in the North Pole zone of the FNSB PM2.5 non-attainment area.
The FNSB has been in non-attainment for PM2.5 since 2009. The main component in PM2.5 in this area is organic carbon as wood heat is believed to be the dominant source. Wood smoke contains many toxic components, but DEC has no information about air toxics levels in the community and the area is a prime location for the addition of a NATTS site.
DEC will monitor air toxics at the site for at least three years and will assess the value of the data collected and assess the health impacts of the pollutants on the community. If the data proves valuable and funding remains available, DEC will seek to continue the site and potentially expand efforts through short- or long-term efforts in other communities.
Other Considerations
Over the years, monitoring activities that are not specifically targeting a regulatory monitoring site have been delayed or deferred due to resource limitations. Dedicated funding and staff expertise is required for some of these initiatives, such as developing a specialized wireless air sensor pod that is calibrated to adequately assess PM in Alaskan communities. In rural communities, limited internet and cellular infrastructure make data telemetry cost-prohibitive when relying on existing off-the-shelf systems. Recent improvements in satellite communications and decreases in subscription costs may lead to better options to access real-time data in remote areas.
To reduce long-term costs and improve operational efficiency, DEC is building a collection of NIST traceable standards that will reduce staff time to package and ship sensitive electronics for recertification, reduce damage in transit, shipping costs, and improve turnaround times. Accurate and timely recertification of standards is crucial to ensuring high quality data, and these vendor costs continue to rise significantly.
DEC has developed an internal system, AirTools, for the disseminations of air quality information and advisories via statewide delivery of email and text alerts for air quality advisories. The public can sign up for these alerts through a MyAlaska2 account. Alerts are also posted on DEC’s website3 and various social media platforms, providing residents with multiple options to receive air quality information.
List of Tables
Table 1 : National and Alaska Ambient Air Quality Standards (NAAQS and AAAQS)
Table 2 : Alaska’s Core Based Statistical Areas.
Table 3 : Alaska Population by Region, Borough, and Census Area, 2023 to 2035.
Table 4 : Communities violating the NAAQS.
Table 5 : PM2.5 24-hour NAAQS 3-year design values (annual 98th percentiles in parentheses), μg/m3
Table 6 : PM2.5 Annual NAAQS 3-year design values (weighted annual means in parentheses), μg/m3
Table 7 : PM10 1st/2nd Maximum 24-hour Average concentrations, μg/m3
Table 8 : CO 1st/2nd Maximum 8-hour average concentrations, ppm.
Table 9 : O3 8-Hour NAAQS 3-year design values (4th maximum values in parentheses), ppm.
Table 10: SO2 1-Hour NAAQS 3-year design values (annual 99th percentile values in parentheses), ppb.
Table 11: PM Equipment inventory – June 2025.
Table 12: Gaseous Equipment inventory – June 2025.
Table 13: Meteorological Equipment inventory – June 2025.
List of Figures
Figure 1 : Map of Alaska - most of the Aleutian Islands (west) is omitted.
Figure 2 : 2020 Census profile map for Alaska.
Figure 3 : Alaska Core Based Statistical Areas (CBSA) and Counties (US Census Bureau)
Figure 4 : Windrose summarizing wind data from 2000 through 2024 at Ted Stevens Anchorage Intl. Airport
Figure 5 : Windrose summarizing wind data from 2006 through 2019 at Elmendorf AFB, AK.
Figure 6 : Windrose summarizing wind data from 2000 through 2024 at Palmer Municipal Airport
Figure 7 : Windrose summarizing wind data from 2000 through 2024 at Wasilla Municipal Airport
Figure 8 : 24-hour PM2.5 3-year Design Values (2020-2024) excluding exceptional events
Figure 9 : 24-hour PM2.5 exceedance days due to natural events.
Figure 10 : PM2.5 annual average 3-year design values (2020-2024).
Figure 11 : PM10 24-hour average 2nd maximum values (2020-2024).
Figure 12 : Schematic of Alaska’s DAS.
List of Acronyms
AAAQS: Alaska Ambient Air Quality Standards
AFB: Air Force Base
AMQA: Air Monitoring and Quality Assurance Program
ANP: Annual Network Plan
APP: DEC Air Permits Program
API: Application Programming Interface
AQI: Air Quality Index
AQS: Air Quality System
ARP: American Rescue Plan
ATV: All Terrain Vehicle
BAM: Beta Attenuation Monitor
CAA: Clean Air Act
CBJ: City and Borough of Juneau
CBSA: Core Base Statistical Area
CFR: Code of Federal References
CO: Carbon Monoxide
COVID-19: Pandemic caused by the coronavirus, severe acute respiratory syndrome coronavirus 2 (SARS-CoV-2), that started in 2019
DAS: Data Acquisition System
DEC: Alaska Department of Environmental Conservation
DOT: Alaska Department of Transportation
EPA: U.S. Environmental Protection Agency
FEM: Federal Equivalent Method
FNSB: Fairbanks North Star Borough
FRM: Federal Reference Method
FTP: File transfer protocol
FWS: Filter weighing system
FY: Fiscal Year
IMPROVE: Interagency Monitoring of Protected Visual Environments
IRA: Inflation Reduction Act
JBER: Joint Base Elmendorf-Richardson
LCS: Low-Cost Sensor/s
LIMS: Laboratory Information Management System
LMP: Limited Maintenance Plan
Mat-Su: Matanuska-Susitna Borough
mg/m3: milli grams per cubic meter
Microns: Micrometer, 1 millionth of a meter
MOA: Municipality of Anchorage
MSA: Metropolitan Statistical Area
MTL: Measurement Technologies Laboratory
NAAMS: National Ambient Air Monitoring Strategy
NAAQS: National Ambient Air Quality Standard
NATTS: National Air Toxics Trends Sites
NCEI: National Centers for Environmental Inflation
NH3: Ammonia
NIST: National Institute of Standards and Technology
NCORE: National Core Site
NO: Nitric Oxide
NO2: Nitrogen Dioxide
NOy: Reactive nitrogen compounds
O3: Ozone
Pb: Lead
PM: Particulate matter
PM10: Particulate matter with an aerodynamic diameter less than 10 micrometers
PM2.5: Particulate matter with an aerodynamic diameter less than 2.5 micrometers
Plant Materials Center: Plant Materials Center
ppb: parts per billion
ppm: parts per million
QA/QC: Quality Assurance/Quality Control
RadNet: Radiation Monitoring Network
SCC: Sharp Cut Cyclone
SIP: State Implementation Plan
SLAMS: State and Local Air Monitoring Stations
SO2: Sulfur Dioxide
SPM: Special Purpose Monitoring
TAPS: Trans Alaska Pipeline System
TSP: Total Suspended Particle
UAF: University of Alaska Fairbanks
VOC: Volatile Organic Carbon
VSCC: Very Sharp Cut Cyclone
μg/m3: micro grams per cubic meter
1 Background
The U.S. Environmental Protection Agency (EPA) finalized an amendment to the ambient air monitoring regulations on October 17, 2006. As part of this amendment, the EPA added the following requirement for state, or where applicable local, monitoring agencies to conduct a network assessment once every five years [40 CFR 58.10(d)].
“(d) The State, or where applicable local, agency shall perform and submit to the EPA Regional Administrator an assessment of the air quality surveillance system every 5 years to determine, at a minimum, if the network meets the monitoring objectives defined in appendix D to this part, whether new sites are needed, whether existing sites are no longer needed and can be terminated, and whether new technologies are appropriate for incorporation into the ambient air monitoring network. The network assessment must consider the ability of existing and proposed sites to support air quality characterization for areas with relatively high populations of susceptible individuals (e.g., children with asthma), and, for any sites that are being proposed for discontinuance, the effect on data users other than the agency itself, such as nearby States and Tribes or health effects studies. For PM2.5 the assessment also must identify needed changes to population-oriented sites. The State, or where applicable local, agency must submit a copy of this 5-year assessment, along with a revised annual network plan, to the Regional Administrator. The first assessment is due July 1, 2010.”
This requirement is an outcome of implementing the National Ambient Air Monitoring Strategy (NAAMS, the most recent version is dated December 2005, U.S. Environmental Protection Agency, 2005). The purpose of the NAAMS is to optimize U.S. air monitoring networks to achieve, with limited resources, the best possible scientific value and protection of public and environmental health and welfare.
A network assessment includes (1) re-evaluation of the objectives and budget for air monitoring, (2) evaluation of a network’s effectiveness and efficiency relative to its objectives and costs, and (3) development of recommendations for network reconfiguration and improvements. EPA expects that a multi-level network assessment will be conducted every five years (U.S. Environmental Protection Agency, 2005).
2 Introduction
In 1970 the Congress of the United States created the U.S. Environmental Protection Agency (EPA) and promulgated the Clean Air Act (CAA). Title I of the Clean Air Act established National Ambient Air Quality Standards (NAAQS) to protect public health. NAAQS were developed for six criteria pollutants: total suspended particulate matter (TSP), sulfur dioxide (SO2), nitrogen dioxide (NO2), carbon monoxide (CO), ozone (O3), and lead (Pb). Subsequent revisions to the particulate matter standard resulted in two new standards: PM10 and PM2.5. The first revision (1987) reduced the size of particulate matter that was considered harmful to humans, measuring for particles less than 10 micrometers (or microns) in diameter (PM10). That standard was later revised (1997) to separate the PM10 size particles into two size fractions: coarse and fine. The coarse particulate matter fraction represents particles between 10 and 2.5 microns and fine particulate matter represents particles 2.5 microns and smaller in diameter (PM2.5).
Threshold limits established under the NAAQS to protect health are known as primary standards. The primary health standards are set to protect the most sensitive of the human population, including those people with existing respiratory or other chronic health conditions, children, and the elderly. Secondary standards established under the NAAQS are set to protect the public welfare and the environment. The CAA instructs EPA to periodically review and revise the NAAQS based on the assessment of national air quality trends and on current and ongoing health studies.
EPA delegated the authority to manage air quality to the states. In Alaska, the Air Quality Division of the Department of Environmental Conservation (DEC) has been evaluating ambient air quality in Alaska since the late 1970s. DEC adopted the NAAQS, but also established its own Alaska Ambient Air Quality Standards (AAAQS) in addition to the federal standards. Table 1 contains the current NAAQS and AAAQS.
EPA created rules and guidance for establishing and maintaining monitoring networks. Requirements for the number of sites in an area depend on a variety of factors, chiefly among them are the ambient concentrations for the specific pollutant and the population numbers. Due to the small population even in our largest metropolitan areas, many of the monitoring requirements triggered by population numbers do not apply to Alaska.
The Air Monitoring and Quality Assurance Program (AMQA) in DEC’s Air Quality Division is responsible for planning and overseeing the State’s monitoring network. The main pollutants of concern in Alaska currently are PM2.5 and PM10 followed in order of importance by CO, Pb, O3, SO2 and NO2.
To assess the adequacy of the existing network, AMQA has to review the current and projected economic conditions throughout the state and as well as the projected population growth. The following chapters will describe these factors, alongside a summary of the distinct ecosystems in the state based on climate and topography, followed by a discussion of the current air quality and the current monitoring strategy.
| NAAQS/ AAAQS | Pollutant | Averaging Time | Level | Form |
|---|---|---|---|---|
| NAAQS | Carbon Monoxide (CO) | 8 hours | 9 ppm | Not to be exceeded more than once per year |
| NAAQS | Carbon Monoxide (CO) | 1 hour | 35 ppm | Not to be exceeded more than once per year |
| NAAQS | Lead (Pb) | Rolling 3-month average | 0.15 μg/m3 4 | Not to be exceeded |
| NAAQS | Nitrogen Dioxide (NO2) | 1 hour | 100 ppb | 98th percentile of 1-hour daily maximum concentrations, averaged over 3 years |
| NAAQS | Nitrogen Dioxide (NO2) | 1 year | 53 ppb 5 | Annual mean |
| NAAQS | Ozone (O3) | 8 hours | 0.070 ppm 6 | Annual fourth-highest daily maximum 8-hour concentration, averaged over 3 years |
| NAAQS | PM2.5 | 1 year | 9.0 μg/m3 7 | annual mean, averaged over 3 years |
| NAAQS | PM2.5 | 24 hours | 35 μg/m3 | 98th percentile, averaged over 3 years |
| NAAQS | PM10 | 24 hours | 150 μg/m3 | Not to be exceeded more than once per year on average over 3 years |
| NAAQS | Sulfur Dioxide (SO2) | 1 hour | 75 ppb 8 | 99th percentile of 1-hour daily maximum concentrations, averaged over 3 years |
| AAAQS 9 | Sulfur Dioxide (SO2) | 3 hours | 0.5 ppm | Not to be exceeded more than once per year |
| AAAQS | Sulfur Dioxide (SO2) | 24 hours | 0.14 ppm | Not to be exceeded more than once per year |
| AAAQS | Sulfur Dioxide (SO2) | annual | 0.030 ppm | Annual mean |
| AAAQS | Ammonia (NH3) | 8 hours | 2.1 mg/m3 | Not to be exceeded more than once per year |
3 Alaska’s Geography, Climate, Topography, and Economy
3.1 Geography and Climate
Alaska comprises one sixth of the United States landmass and has a population density of 1.3 persons per square mile. The state spans 20 degrees of latitude (51°N – 71°N) and 58 degrees of longitude (130°W – 172°E) and contains 65% of the U.S. continental shelf, more shoreline than the rest of the 49 states combined, 17,000 square miles of glaciers, 3,000,000 lakes that are over 20 acres in size, and receives 40% of the U.S. fresh water runoff. Figure 1 shows a map of Alaska and the diverse climate regions described below.
The Panhandle is a temperate rain forest in the southeastern part of Alaska that mainly comprises mountainous islands and protected marine waterways. Rainfall exceeds 100 inches per year in many areas. Most communities are small and have less than 5,000 year-round residents. Juneau, the State’s capital, is the largest city in the region with a population of approximately 32,000.
The South Gulf Coast is one of the wettest regions in the world. Yakutat receives over 150 inches of non-thunderstorm rain per year and Thompson Pass averages over 700 inches of snow annually. The area is covered with rugged mountains and barren shoreline and is the target of many Gulf of Alaska storms. This coastline contains a handful of small fishing communities.

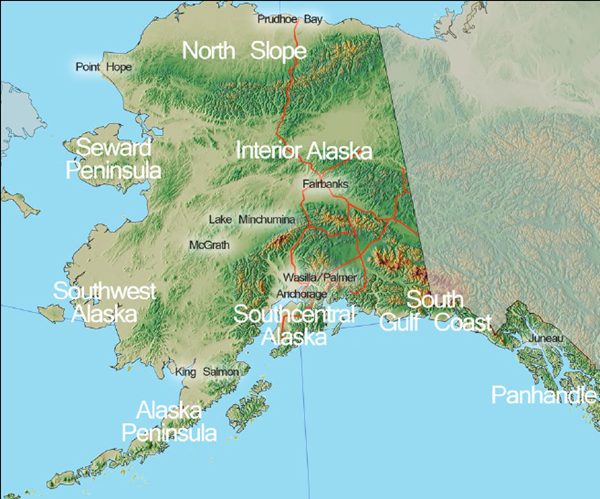
Figure 1. Map of Alaska - most of the Aleutian Islands (west) is omitted
Southcentral Alaska is fairly temperate in comparison to the rest of Alaska. Rainfall varies widely across the region, averaging between 15 inches per year in the Matanuska-Susitna (Mat-Su) Valley and 60 inches per year in Seward. This region contains 60% to 70% of the state’s population with Anchorage, the state’s largest city, home to 289,600 people. Bounded by active volcanoes on the southwest and glacial river plains to the northeast, this sector of the state has experienced PM10 24-hour dust levels exceeding 1,000 μg/m3.
The Alaska Peninsula and its westward extension, the Aleutian Chain, form the southwestern extension of the mountainous Aleutian Range. This region comprises remote islands and small, isolated fishing villages. This area is one of the world’s most economically important fishing areas, as well as a vital migratory route and nesting destination for birds.
Southwest Alaska encompasses the vast Yukon-Kuskokwim River Delta, a wide low-lying area formed by two of the state’s major river systems and dotted with hundreds of small lakes and streams. This region is heavily impacted by storm systems which rotate northward into the Bering Sea. Communities in this region receive between 40 and 70 inches of precipitation each year. This portion of the state is quite windy, experiencing winds between 15 – 25 miles per hour throughout the year. These winds, coupled with fine delta silt, help to create dust problems for some southwestern communities. Rural villages normally contain fewer than 500 people and are located along the major rivers and coastline. Regional hub communities, such as Bethel, may have up to 6,100 residents.
Interior Alaska describes the vast expanse of land north of the Alaska Range and south of the Brooks Range. This region contains Fairbanks, Alaska’s second largest city, with a population approaching 32,000 people (94,951 in the borough). The climate varies greatly with clear, windless, -50°F winter weather giving way to summer days with 90°F temperatures and afternoon thunderstorms. Sectors of this region also experience blustery winds and high concentrations of re-entrained particulates from open riverbeds.
The Seward Peninsula is the section of Alaska which extends westward into the Bering Sea between Norton Sound and Kotzebue Sound. This hilly region is barren and windswept with 15-25 mile per hour winds common. Rainfall in this region averages between 15 and 24 inches per year. Villages in this region are small, except for Nome which has over 3,000 people.
The North Slope region, located north of the Brooks Range, is an arctic desert receiving less than ten inches of precipitation annually. Wind flow is bimodal, with the easterlies dominating the meteorological patterns. Winter wind speeds average 15-25 mile per hour dropping off slightly during the summer. The North Slope is extremely flat and supports huge summertime populations of bears, caribou, and migratory birds.
3.2 Topography
Alaska topography varies greatly and includes seven major mountain ranges which are significant enough to influence local and regional wind flow patterns. The mountains channel flow, create rotor winds, cause up slope and down slope flow, initiate drainage winds, produce wind shear and extreme mechanical turbulence. For air quality impact analyses, Alaska’s rugged mountains can only be described as complex terrain making many air quality models unsuited for use in the state. The complexity of most local meteorology renders the use of non-site specific meteorological data inadequate for most control strategy development.
In addition to mountains, Alaska has several deserts, some north of the Arctic Circle, extensive wetlands, numerous glaciers, and large deep fjords with very high tides and strong tidal currents. Local wind flow patterns along the coast and near large lakes may be influenced by land/sea breezes.
3.3 Economy
The Alaskan economy is heavily influenced by several industries, this includes: the oil industry, the mining industry, commercial fishing, logging, and tourism. Of the five, only the oil and mining industries provide a year-round source of income to the state and these industries typically require the full-time operation of stationary power generation equipment.
Alaska’s oil and natural gas development continues to be centered on leases located primarily on the North Slope and in and around Cook Inlet. The state’s oil industry operates production wells in Cook Inlet and on the North Slope. North Slope oil is pumped 800 miles through the Trans-Alaska Pipeline System (TAPS) to Valdez for shipment to refineries in the lower 48 states. The TAPS has several pump stations to maintain the flow of oil in the pipeline. Despite ongoing production, the sector faces challenges due to fluctuations in oil prices. In recent years, oil prices have remained volatile, contributing to a decrease in state revenue from the industry. In fact, the state’s oil and gas revenue, which historically accounted for over 80% of the general fund revenues, has been sharply reduced. By 2023, this contribution had dropped to around 40% of the unrestricted general fund revenue, reflecting the broader trend of price instability. Additionally, the state is focused on developing new oil exploration on the North Slope, although the industry’s role in Alaska’s economy is increasingly affected by global market conditions and changing energy policies. Efforts to diversify energy production in the state, including renewable energy initiatives, are gaining traction, but oil and gas remain critical sources of income for Alaska’s government. Alaska also faces workforce shortages in the oil and gas sector, which could further impact economic expansion in the coming years 10.
Mining is a stable employment sector in Alaska. Estimated total mineral industry employment in 2025 is estimated at 5,400 full-time equivalent jobs11. The value of the industry is well over $1 billion annually and is expected to grow over the coming decade12. The state has six large lode mines and an estimated 241 placer operators. The large mines are the Teck Resources Ltd.-NANA Red Dog Mine (zinc, lead, silver) near Noatak, the Coeur Alaska Inc. Kensington complex (gold) between Juneau and Haines, the Hecla Mining Greens Creek mine (silver, gold, zinc, lead) near Juneau, the Kinross Gold Fort Knox Mine (gold) near Fairbanks, the Northern Star Pogo Mine (gold) near Delta Junction, and the Usibelli Mine (coal) near Healy. Numerous other small mining ventures exist across the state.
Alaska’s timber industry, another important economic sector, has been in decline in recent years. In the 1970s, forest products were the second largest industry in the state. Timber has been exported as logs, lumber and timbers into the Pacific Rim for the past five decades and for many years, lower quality timber was used to produce pulp for the world market. With shifts in land use, political and economic pressure, the industry has been in decline since the 1990s. Commercial logging has primarily taken place in the coastal zone including the 16.8 million acre Tongass National Forest and Native corporation land in Southeast and coastal Southcentral Alaska. The Chugach National Forest in Southcentral Alaska is the nation’s second largest national forest with 4.8 million acres. Timber harvests also occur on state “boreal” forest lands in Interior Alaska, which is experiencing slow, but steady growth as wood biomass projects are developed to meet community needs for economic space heating and electrical generation13.
Tourism is also a major sector of Alaska’s economy attracting over a million visitors annually. Spending by visitors drives the economy creating jobs and income in a wide variety of sectors including transportation, retail, and lodging. In 2023, total employment in Alaska’s visitor industry was estimated at 48,000 jobs across the state14. The role of tourism is particularly important in the Southeast region where it accounts for 20% of employment and 13% of labor income. As of recent years, tourism continues to be a vital economic sector, although recent data from 2023 shows a mixed outlook due to shifts in the global economy.
The seafood industry is a cornerstone of the state’s economy, supporting roughly 48,000 jobs and approximately $6 billion in total economic activity in Alaska (2021-2022)15. Despite facing significant challenges in 2022 and 2023, which resulted in a $1.8 billion loss for the industry, seafood continues to be a major export. Each year 5 to 6 billion pounds of seafood are harvested. Export markets typically account for approximately two-thirds of sales value, while the U.S. market buys the remaining one-third. Commercially important seafood species include salmon, crab, pollock, halibut, cod, and flatfish which account for 90% of Alaska’s ex-vessel value of seafood. However, the industry’s struggles highlight the need for adaptation and investment to maintain its long-term sustainability.
4 Alaska’s Population
Alaska comprises one-sixth of the United States landmass and has a population density of 1.3 persons per square mile. The 2020 census map (Figure 2) illustrates the actual population distribution across the state. There are vast stretches of the state with population densities of less than 1.3 persons per square mile.
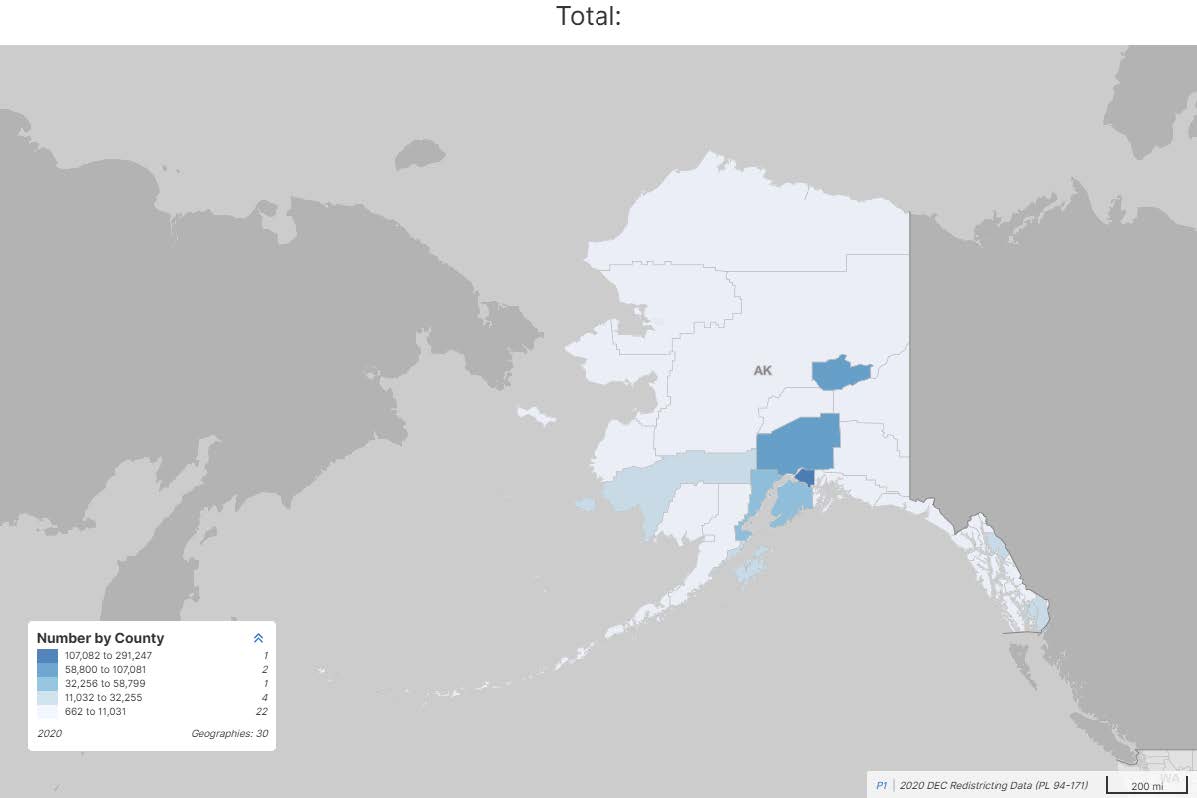
Figure 2. 2020 Census profile map for Alaska16
The 2020 census numbers show the state’s total population at 733,39117. In 2024, the population is estimated at 740,133. Roughly half of Alaska’s residents live in Anchorage and the surrounding communities of the Matanuska – Susitna Valley (Table 2). The state has one medium-sized, core-based statistical area comprising the Municipality of Anchorage (the central unit of this core-based statistical area (CBSA)) and the communities of Wasilla and Palmer (the outlying portion of the CBSA) (Figure 3). The Fairbanks North Star Borough in the interior of Alaska is the second largest population center and a small CBSA. The Juneau City and Borough and Ketchikan Gateway Borough, in Southeast Alaska, are both micropolitan areas. Approximately one fourth of Alaska residents live outside a CBSA.
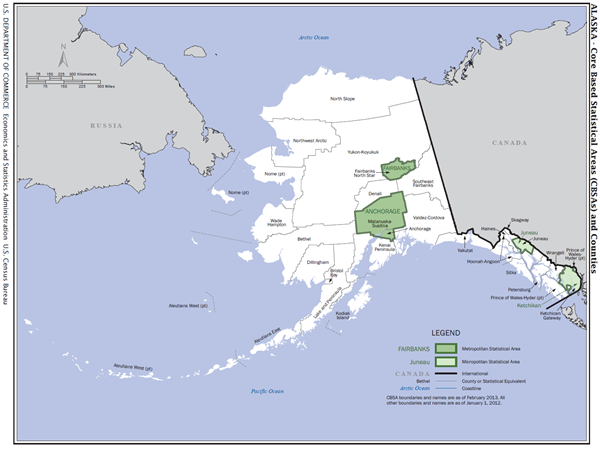
Figure 3. Alaska Core Based Statistical Areas (CBSA) and Counties (US Census Bureau)
| CBSA | Population18 | Includes: | CBSA category |
|---|---|---|---|
| Anchorage, MSA | 401,314 |
Municipality of Anchorage (289,600) Matanuska-Susitna Borough (17,613) |
Metropolitan (Medium CBSA) |
| Fairbanks North Star Borough | 94,951 | - | Metropolitan (Small CBSA) |
| Juneau City and Borough | 31,572 | - | Micropolitan |
| Ketchikan Gateway Borough | 13,677 | - | Micropolitan |
Table 3 summarizes the 2023 population distribution among the six major Alaska population regions19. In 2018, eighty percent of Alaska’s residents lived in communities with a population of 2,500 or more20. The 2023 report does not specifically calculate the updated rate, but with the slow rate of growth this population distribution likely has not changed significantly. The Alaska Department of Labor and Workforce Development projects the highest growth rate within the state to occur in the Matanuska- Susitna Borough (15% increase between 2023 and 2035). DEC had enlarged its regulatory monitoring network to three monitoring sites in this area in response to population increases in 2010. However, due to budget cuts and reduced staffing, DEC consolidated some of its operations by decommissioning the Wasilla site in March 2015 and the Palmer site in 2019. The site in Butte (PM2.5, PM10) was closed in 2023 due to resident complaints about the location. The Plant Materials Center was opened in the place of the Butte site and is intended to remain in the monitoring network long term.
| Region | July 1, 2023 Estimate | July 1, 2025 Projection | July 1, 2030 Projection | July 1, 2035 Projection |
|---|---|---|---|---|
| Alaska | 736,812 | 738,365 | 742,758 | 742,801 |
| Anchorage/Mat-Su Region | 403,573 | 404,235 | 409,479 | 412,305 |
| Anchorage, Municipality | 289,653 | 288,754 | 285,931 | 281,302 |
| Matanuska-Susitna Borough | 113,920 | 115,481 | 123,548 | 131,003 |
| Gulf Coast Region | 83,154 | 84,058 | 84,357 | 83,900 |
| Chugach Census Area | 6,868 | 6,777 | 6,625 | 6,430 |
| Copper River Census Area | 2,667 | 2,648 | 2,685 | 2,691 |
| Kenai Peninsula Borough | 60,898 | 62,090 | 63,138 | 63,158 |
| Interior Region | 109,801 | 109,524 | 108,893 | 107,509 |
| Denali Borough | 1,663 | 1,625 | 1,570 | 1,508 |
| Fairbanks North Star Borough | 95,972 | 95,701 | 94,976 | 93,616 |
| Southeast Fairbanks Census Area | 7,038 | 7,082 | 7,465 | 7,730 |
| Yukon-Koyukuk Census Area | 5,128 | 5,116 | 4,882 | 4,655 |
| Northern Region | 27,723 | 27,807 | 28,001 | 28,260 |
| Nome Census Area | 9,628 | 9,528 | 9,527 | 9,476 |
| North Slope Borough | 10,631 | 10,880 | 11,203 | 11,583 |
| Northwest Arctic Borough | 7,464 | 7,345 | 7,271 | 7,201 |
| Southeast Region | 71,077 | 70,863 | 69,155 | 67,019 |
| Haines Borough | 2,530 | 2,535 | 2,478 | 2,408 |
| Hoonah-Angoon Census Area | 2,298 | 2,324 | 2,269 | 2,216 |
| Juneau, City and Borough | 31,549 | 31,438 | 30,975 | 30,270 |
| Ketchikan Gateway Borough | 13,475 | 13,423 | 13,006 | 12,522 |
| Petersburg Borough | 3,367 | 3,329 | 3,297 | 3,225 |
| Prince of Wales-Hyder Census Area | 5,784 | 5,830 | 5,639 | 5,416 |
| Sitka, City and Borough | 8,231 | 8,154 | 7,831 | 7,475 |
| Skagway, Municipality | 1,127 | 1,176 | 1,147 | 1,112 |
| Wrangell, City and Borough | 2,039 | 1,988 | 1,845 | 1,701 |
| Yakutat, City and Borough | 677 | 666 | 668 | 674 |
| Southwest Region | 41,484 | 41,878 | 42,873 | 43,718 |
| Aleutians East Borough | 3,558 | 3,608 | 3,727 | 3,833 |
| Aleutians West Census Area | 4,893 | 5,024 | 5,138 | 5,252 |
| Bethel Census Area | 18,193 | 18,277 | 18,815 | 19,255 |
| Bristol Bay Borough | 809 | 795 | 761 | 726 |
| Dillingham Census Area | 4,565 | 4,566 | 4,441 | 4,333 |
| Kusilvak Census Area | 8,122 | 8,260 | 8,667 | 9,028 |
| Lake and Peninsula Borough | 1,344 | 1,348 | 1,324 | 1,291 |
5 Meteorological Summary
5.1 Statewide Meteorology
Alaska experiences some of the most diverse weather patterns in the world. On any given day, temperatures across the state may vary by more than 100° F, winds may exceed hurricane force, it may be snowing on the North Slope and raining in the Panhandle. Driven by the position of the Polar Jet Stream, Alaska’s weather may be influenced by strong North Pacific lows or a ridge of very high pressure over the Interior. When coupled with Alaska’s complex topography, large temperature swings (both daily and seasonally) and large variation in daylight (zero to twenty-four hours), the resulting synoptic/micro-scale weather frequently causes or contributes to most, if not all, pollution events detected in the state. These dynamic weather patterns, increasingly influenced by climate change, necessitate the use of recent data in air quality modeling, as detailed in the policy section of this plan.
Alaska’s weather falls into four general climatic zones: (1) a maritime zone which includes Southeast Alaska, the South Central Coast, and the Aleutian Islands; (2) a maritime continental zone which includes the western portions of Bristol Bay and Southwest Alaska where summer temperatures are moderated by the Bering Sea, but winter temperatures act more “continental” due to the presence of sea ice; (3) a continental zone which starts north of the coastal mountains and east of the maritime-continental zone and includes most of Interior Alaska, and (4) an arctic zone which covers Northwest Alaska and the Arctic slope. Each one of these climate patterns causes weather which has the potential to contribute to an air pollution event by: drying out the surface layer and enhancing the potential for forest fire activity (fine particulates), increasing area-wide winds and causing dust to be blown high into the air (coarse particulates), increasing local winds which produce mechanically re-entrained dust (coarse particulates), or through the development of strong temperature inversions which trap pollution close to the ground (fine particulates and carbon monoxide). Since the mid-2010s, warming trends and extended wildfire seasons—exemplified by record heat in 2016 and 2019—have amplified these effects, underscoring the need for current data to capture these shifts.
In general, most of Alaska’s weather is driven by two inter-related meteorological features: the position of upper-level highs and lows and the tracking of the polar jet which is responsible for steering surface weather patterns across the North Pacific and into Alaska. During the summer months when the jet stream tracks further north, surface lows often rotate up through South Central Alaska into the Interior. In the winter, the jet often positions itself further south allowing high pressure to dominate a majority of Alaska’s weather, especially in the Interior where temperatures frequently drop below minus fifty degrees Fahrenheit. As these pressure features move and develop, they may intensify north-south pressure gradients producing high winds [increasing entrainment of anthropogenic (man-made) or natural dust] or weaken the regional flow helping to intensify strong surface inversions which trap air pollution (smoke, carbon monoxide, ozone) close to the ground. As a result, the statewide meteorology has played a large role in most of Alaska’s previously documented air pollution events, including some violations of the NAAQS.
5.2 Air Pollution and Meteorology
A good knowledge of the local and regional meteorology is a key element in understanding air pollution episodes and how to implement effective control strategies which will protect the public. While some air pollution events are man-made (community generated dust, industrial pollution) many would not occur without a direct contribution from the weather. Alaska did not have a large number of automobiles in Anchorage or Fairbanks during the 1980s and 1990s, yet both communities exceeded the federal standard for airborne carbon monoxide during periods of strong winter inversions. Similarly, winter inversions have helped create high levels of smoke in Juneau and the Fairbanks North Star Borough as residents use wood or other solid fuel burning devices to heat their homes. Since the rise in fuel oil home heating costs in 2008/9, people are continuing to re-discover the wood-fired heater. While providing independence during emergencies and guaranteed back-up heat, these units are not always energy efficient and create smoke. As the number of wood-fired heating sources increases, the concentration of smoke increases, especially on cold, clear winter nights. These emissions have the potential to exceed the air quality standards that were developed to protect public health. Accurate modeling of such events relies on current meteorological and pollutant data, a requirement now formalized in the Division’s data recency policy.
Alaska’s high winds are notorious for scouring fine material off hillsides and riverbeds creating dust storms which obscure visibility and impact public health. Regional winds, while not directly causing pollution events, do transport dust and wood smoke tens to hundreds of miles away from their sources, impacting public health. Ash from volcanic eruptions as well as sulfur dioxide plumes can travel far distances - events like the 1992 eruptions of Mount Spurr that impacted Alaskan communities from the interior to the southeast panhandle and 2021 Sheveluch eruption in Kamchatka, Russia, demonstrated this with ash reaching the Aleutian.
Most rural communities do not have paved streets and road dust is the most often noted air quality concern in small communities across the state. The problem is not as severe in the larger cities. However, in addition to urban gravel roads, winter sanding materials often become ground up due to traffic and create road dust problems in the spring.
Luckily, Alaska does not have many major pollution sources in close vicinity of communities. The sources that do exist are controlled under air pollution permits that closely regulate air emissions. At present, all major anthropogenic sources in the Cook Inlet Basin, the most populated area of the state, are in compliance with the air quality standards and their emissions do not travel towards other populated areas with significant pollution sources. While the impact from anthropogenic sources is believed to be minimal (not exceeding the NAAQS), Alaska does have major sources of air pollution: wildland fires, windblown dust from natural sources of crustal materials, and particle emissions from volcanic eruptions, all of which are uncontrollable and have intensified with climate shifts since 2015.
DEC’s Division of Air Quality has a meteorologist/forecaster on staff. The role of this employee is to provide meteorological support to the entire Air Quality Division as well as local air agencies and the public. This support includes all facets of meteorological data, data interpretation and analysis, and weather forecasting. The meteorologist also issues air advisories to the public based on air pollutant data, satellite imagery, and weather observations when an air quality episode is occurring or is expected to occur. The state, through its meteorologist, has access to all recorded weather information in real-time and through the archives at the National Centers for Environmental Information (NCEI). Complementing this localized approach, the Division has also adopted a new policy to ensure that the data underpinning these efforts remains representative of Alaska’s changing climate21.
DEC’s new policy on the temporal representativeness of modeling input data establishes that modeling input data files used in air quality permit applications must generally be no more than ten years old. This standard reflects evolving environmental conditions and recent scientific findings, including several climate reports specified in the policy document. Data sets older than a decade are presumed not to be temporally representative unless justified through pre-application consultation. Implementation responsibility lies with the Air Permits Program (APP) and the AMQA Program Managers.
This updated 5-year assessment plan reflects Alaska’s evolving approach to air quality management, incorporating recent meteorological insights and the referenced data recency policy to address the challenges of climate change. By maintaining a focus on local control strategies and leveraging current data, the Division of Air Quality continues to protect public health amidst the state’s unique and shifting environmental conditions.
5.3 Core Based Statistical Area (CBSA)
When a controllable pollution event occurs repeatedly, the state is required to develop a control strategy which will lower emissions to an acceptable level. To better control sources of air pollution and minimize impact on the public, the US EPA has developed an enhanced control strategy for states which groups adjacent communities with similar man-made pollution sources into a CBSA. The intent is to make sure that if elevated levels of pollution exist, the control strategy is effective and includes all contributing sources. In Alaska, where most communities are small and separated significantly by geography, the practicality of employing the CBSA concept to fix a localized air pollution problem does not make sense, in most cases. For the few locations where multiple communities lie adjacent to each other e.g., Fairbanks North Star Borough (City of Fairbanks, North Pole, Fort Wainwright and Eielson Air Force Base (AFB)), the Upper Cook Inlet Basin (Municipality of Anchorage, Girdwood, Eagle River, Chugiak, Wasilla, and Palmer) and the Northern Kenai Peninsula (Nikiski, Kenai, and Soldotna), either the meteorology does not necessarily support the need for development of a CBSA or the multi-community airshed is already being legally controlled.
Fairbanks North Star Borough: All the communities and associated man-made sources of pollution are contained in the Borough. The Borough has legal and governing authority over the area making the development of a CBSA unnecessary. At present, the greater Fairbanks area is designated in non-attainment with the 24-hour PM2.5 standard in the winter when strong inversions help to trap air pollution close to the ground. The Fairbanks North Star Borough (FNSB) non-attainment area boundaries include the cities of Fairbanks and North Pole, and Fort Wainwright, but not Eielson Air Force Base. Over the past fifteen years, control strategies have resulted in a downward trend in PM2.5 concentrations in Fairbanks, and within the last ten years in the North Pole area as well, although the North Pole area still experience extreme wintertime pollution. The State of Alaska continues to refine an effective control strategy, with notable progress by 2025 through measures like wood stove changeout programs and enhanced monitoring.
Northern Kenai Peninsula (Nikiski, Kenai, Soldotna): Flow on the northwest coast of the Kenai Peninsula is similar to that observed in Anchorage, primarily north-south. While southerly winds seem to occur at a similar frequency, Kenai experiences twice as many northerlies, probably because it lies forty miles of longitude west of Anchorage and experiences the northerly drainage winds coming down the west side of the basin. The Kenai winds differ greatly from those observed in Soldotna, which exhibits a much weaker flow that is more east-west and somewhat terrain induced. In general, the meteorological flow pattern for the peninsula does not suggest that these communities be considered a CBSA or be added to any other community to form one.
Upper Cook Inlet Basin (Anchorage, Joint Base Elmendorf-Richardson (JBER), Wasilla, Palmer): Flow in the upper basin is generally bi-modal with the strongest flow due to northerly drainage winds and southerly storm flow. The combination of these winds with the region’s mountainous terrain creates a pattern which is not conducive for transporting anthropogenic pollution from one community to the others. In addition, there are no major industrial sources north of Anchorage and all of the existing sources are in compliance with the NAAQS and air quality increments. The region has had some air pollution problems in the past, but those have been very localized (road dust, carbon monoxide, and wood smoke) and not transported between communities. The only transport of pollution into Anchorage occurred in the mid-1980s when the state allowed farmers at Point Mackenzie to the north of Anchorage, to burn slash from land clearing. The region does have occasional, naturally occurring pollution events (volcanic eruptions, wildland fire smoke, windblown dust from the river drainages, episodic Asian dust events) for which the state issues air quality advisories as necessary, but which are not controllable.
The Municipality of Anchorage is a good example of how different the local flow can be. In Girdwood (south end of the Municipality) and Chugiak/Birchwood (northeast side of the Municipality) weather conditions are often completely different from each other. At the same time, their winds do not represent those observed at Anchorage’s airport, just west of downtown. A dust event in east Anchorage does not normally equate to one in south Anchorage, Girdwood or Palmer. On the other hand, smoke from wildland fires in the Interior of Alaska can be transported into Anchorage or across greater distances. The wind roses in Figures 4 through 7 for Anchorage, JBER, Wasilla, and Palmer show how different the wind patterns are.
Based on the State’s analysis of local and regional meteorology which examined annual wind rose data (Figures 4 - 7), short term wind events, the location of major anthropogenic sources of pollution, and emissions modeling for the major sources of pollution, Alaska is not planning to create CBSAs for any portion of the state as a method for controlling man-made air pollution events in the state. Any exceedance encountered will be handled locally between the state and local governments.
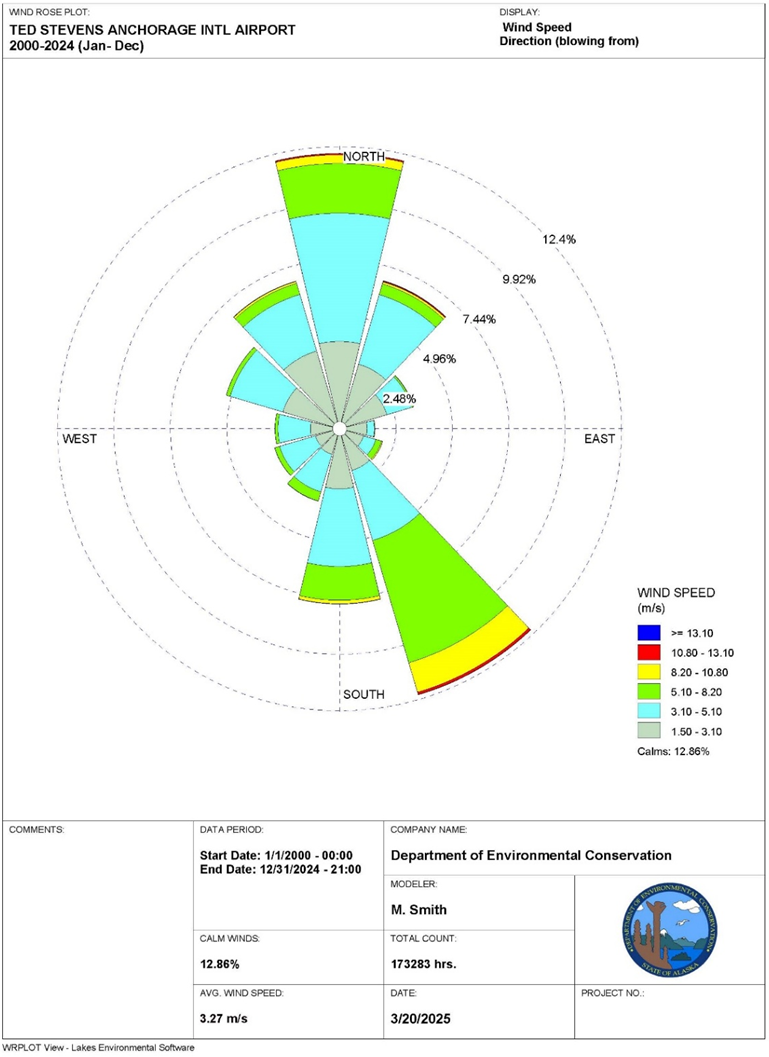
Figure 4. Windrose summarizing wind data from 2000 through 2024 at Ted Stevens Anchorage Intl. Airport
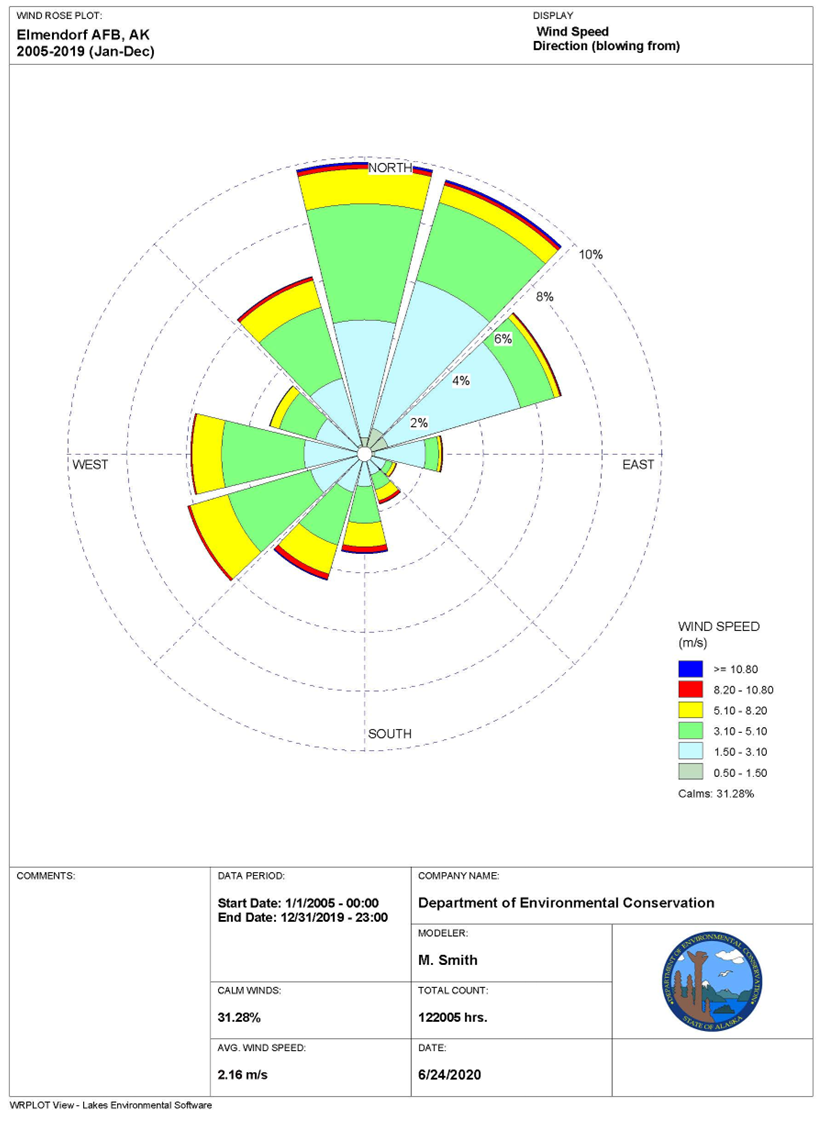
Figure 5. Windrose summarizing wind data from 2006 through 2019 at Elmendorf AFB, AK
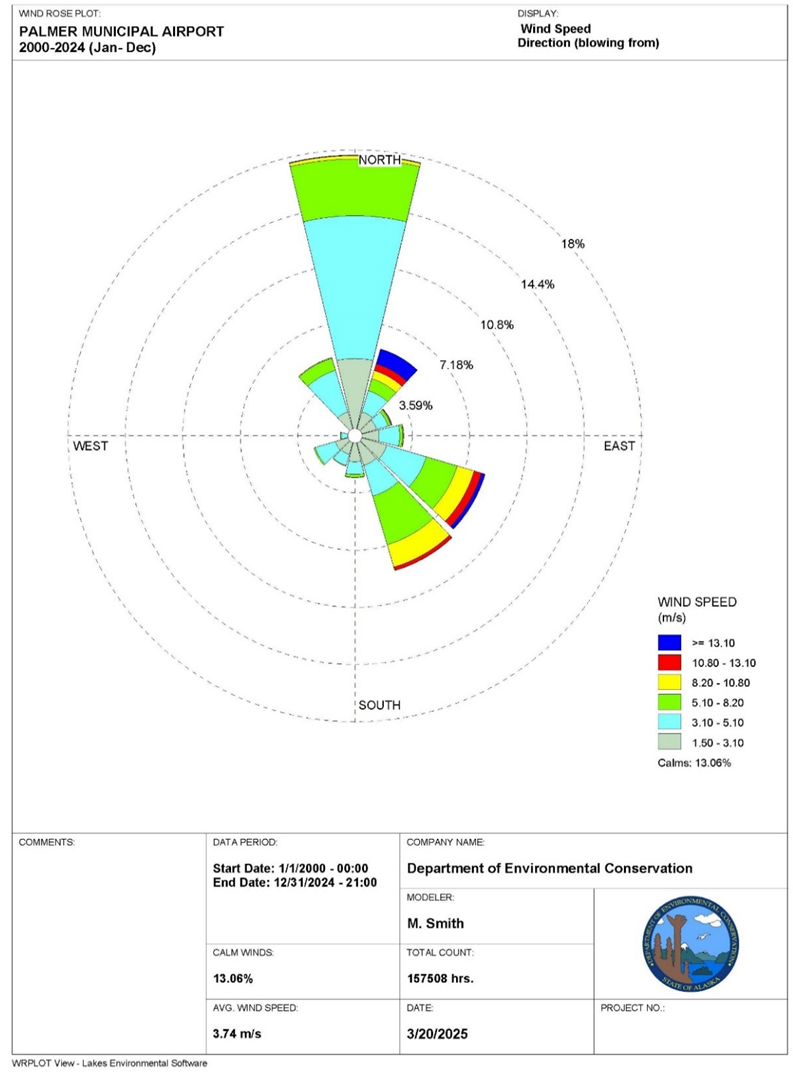
Figure 6. Windrose summarizing wind data from 2000 through 2024 at Palmer Municipal Airport
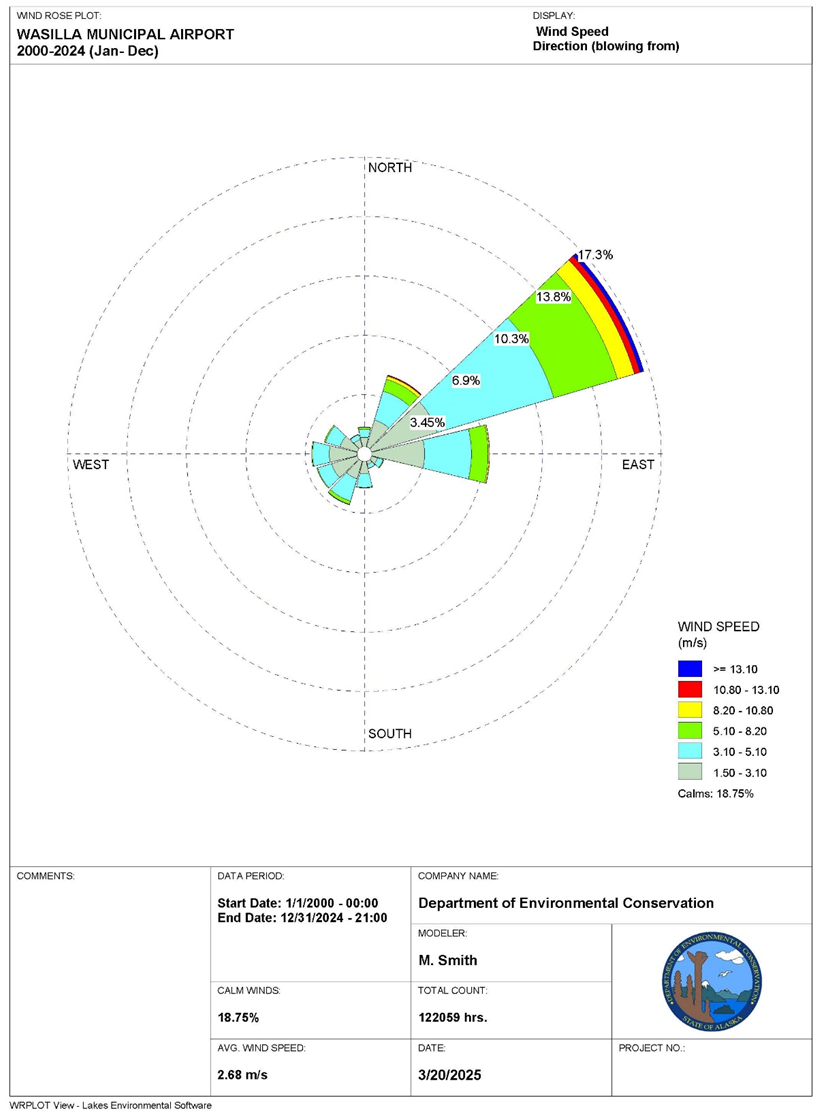
Figure 7. Windrose summarizing wind data from 2000 through 2024 at Wasilla Municipal Airport
6 DEC’s Air Monitoring Strategy
Because of Alaska’s size and its small population density of approximately 1.3 residents per square mile, it is cost prohibitive to monitor in all areas of the state or even the majority of the well dispersed 355 Alaskan communities. Therefore, AMQA has taken a four-pronged approach to the monitoring network design:
-
Monitoring in larger communities to cover the largest possible population exposure with a stable long term network of monitors
-
Monitoring in designated smaller towns that are representative of multiple communities in a region. This monitoring is generally performed as shorter term studies in the range of several months to a few years.
-
Monitoring in response to air quality complaints or emergencies. For this AMQA has had to rely on the public to help identify potential air quality issues and these studies are often conducted shorter term, using portable analyzers and samplers.
-
Monitoring using low-cost sensors (LCS) in underserved communities across the state.
Air monitoring has historically focused on Alaska’s largest population centers: the Municipality of Anchorage and Matanuska Susitna Borough, the Fairbanks North Star Borough, and the City and Borough of Juneau. This is also where the regulatory monitoring sites have been established. Due to stagnant or decreasing funding for air quality assessments over the past ten years the program had to reduce the monitoring to the required regulatory sites based on EPA requirement for CBSAs.
Since the last network assessment in 2020, the monitoring network has seen an overall reduction in sites and resources. Currently, all air quality monitoring statewide, except for citizen science monitoring projects, regional haze (IMPROVE) monitoring, and industry monitoring for permit applications, is conducted by the State’s AMQA program.
6.1 Sensor Network
With the emergence of new LCS technologies, expanding air monitoring into remote areas of the state has become economically feasible. Incrementally the State has established the Community-Based Air Monitoring network, deploying LCS pods in rural and tribal communities across the state to collect baseline air quality data in communities that have been previously underserved. To date, DEC has a fleet of 55 QuantAQ ModulairTM pods. As many areas never had any air quality data collected, DEC decided on multi-pollutant sensor pods. Challenges with cell phone connectivity have hampered the expansion of the sensor network into large portions of the state, especially the Interior and Southwest Alaska. DEC is currently researching sensors that are Wi-Fi-enabled to expand the sensor network into areas with cellular connectivity challenges.
7 Alaska’s Air Quality Monitoring Priorities
Alaska’s ambient air quality issues focus on particulate matter. Almost every community in the state can be impacted by wildland fire smoke during the summer and road dust from gravel roads, exposed riverbeds, or other sources of windblown dust.
While other pollutants are also emitted into the atmosphere, the combination of comparatively small population centers, limited number of stationary sources, the location and density of industries, and the lack of sunlight to support the formation of photochemical pollutants, result in lower concerns for the other criteria pollutants.
While DEC is required to look at all NAAQS, the following pollutant monitoring efforts are of the most interest to Alaskans:
-
Fine particulate matter (PM2.5) monitoring
-
Coarse particulate matter (PM10) monitoring
-
Wildland fire monitoring (PM2.5)
-
Carbon monoxide (CO) monitoring
-
Lead (Pb) monitoring
-
Ozone (O3) monitoring
Table 4 summarizes the extent of these seven pollutants by listing communities violating the NAAQS.
| Priority | Pollutant | Communities violating NAAQS |
|---|---|---|
| 1 | PM2.5 | Fairbanks North Star Borough |
| 2 | PM10 | Several rural communities22 |
| 3 | CO | none |
| 4 | Pb | none |
| 5 | Ozone | none |
| 6 | SO2 | none |
| 7 | NO2 | none |
The current network consists of eight sites with a total of 26 monitors. Three of these sites are in the Fairbanks North Star Borough, three in the Municipality of Anchorage, one in the Matanuska-Susitna Borough, and one in the City and Borough of Juneau.
7.1 Fine Particulate Matter (PM2.5)
Combustion processes are the primary sources of fine particulates in the atmosphere. Health research has found that PM2.5 size particles are creating a major health problem in communities across the United States. Numerous studies not only identify respiratory impacts, but also a high rate of cardiovascular diseases associated with particles which penetrate deep into the lungs. For people in Alaska, this problem is exacerbated by increased exposure to fine particulate during extended wintertime temperature inversions with extreme cold temperatures, and wildland fires during the summer months.
Fine particulates have been a concern in some Interior Alaska communities, especially during the winter months when extremely strong inversions trap emitted particles close to the surface. In the smaller, outlying villages, this problem is normally associated with wood smoke. In large communities, like in the Fairbanks North Star Borough, the pollution mix is comprised of wood smoke from home heating, emissions from oil based home heating, automobiles, power generation, and other local combustion sources.
7.2 Coarse Particulates (PM10)
PM10 or ‘dust’ impacts most people living and visiting the State of Alaska and has been a pollutant of concern for over 45 years. Monitoring for dust in the major communities of Anchorage, Juneau, the Mat-Su Valley, and Fairbanks has been going on for over twenty-five years. As a result, two locations in the State were designated non-attainment for dust in 1991: the Municipality of Anchorage (Eagle River) and Mendenhall Valley in the City and Borough of Juneau (CBJ or Juneau).
Eagle River, a community of about 30,000 located 10 miles northeast of downtown Anchorage, was designated as a non-attainment area for airborne particulate (PM10) in 1987. This designation was the result of air quality violations recorded between 1985 and 1987 when the community was largely “rural” and had many unpaved roads. In addition, the TSP monitor was located on the top of a one story building extension adjacent to a highly trafficked gravel road. The Municipality of Anchorage developed a PM10 control plan which focused on paving or surfacing the communities gravel roads. This strategy was very effective (all local roads were paved or treated with recycled asphalt) and no violations were measured between October 1987 and late March 2025. On March 24th, 2025, a PM10 exceedance of 174 μg/m3 at the Laurel monitoring site in Anchorage was measured. The exceedance occurred during a time of staff training and transition at the Municipality of Anchorage (MOA) that impacted road dust palliative application. After the EPA decided not to adopt a proposed regulation provision that would have automatically reclassified areas like Eagle River with long periods of compliance with the standard from non-attainment to maintenance areas, the Municipality of Anchorage developed a Limited Maintenance Plan (LMP) for Eagle River23. This was submitted to the EPA for approval in September 2010. The EPA approved the LMP on January 7, 201324. The second 10-year LMP explains how Eagle River currently meets and will continue to meet the 1987 NAAQS for PM10 through 2033. The EPA approved the second 10-year LMP, effective December 9, 2021.
Juneau’s Mendenhall Valley was designated non-attainment for PM10 on November15, 1990. The two primary sources of PM10 required the community to develop two primary control measures to minimize exceedance of the standard. The first was to issue alert notices for people to curtail the use of woodstoves to reduce the impact from wood smoke and the second was to pave or treat roads to minimize the impact of fugitive dust. The City and Borough of Juneau (CBJ) and the DEC submitted a request to re-designate Juneau as a limited maintenance area with the EPA in February 2009.
The EPA approved the re-designation on May 9, 2013. The second 10-year LMP explains how Mendenhall Valley currently meets and will continue to meet the 1987 NAAQS for PM10 through 2033. The EPA approved the second 10-year LMP, effective November 25, 202125.
Road dust has also been identified as a problem in most of the rural communities in Alaska. Except for the “hub” communities, most of the smaller villages have a limited road system and few resources to pave roads. Additionally, the soil composition is often frost-susceptible and poorly suited for traditional paving methods. With the use of all-terrain vehicles (ATV or 4-wheelers) and automobiles, the amount of re-entrained dust into the air has increased substantially. On a dry summer day, dust levels can easily reach the mid 300 μg/m3 range with maximum concentrations easily exceeding 500 μg/m3. To address the rural dust problem, which was identified during a several year joint-monitoring effort of DEC, village environmental staff, and the State of Alaska Department of Transportation (DOT), DOT secured funding from the State Legislature for a dust control program. That demonstration project started in summer 2010 with eight rural villages and was spearheaded by DOT in conjunction with researchers at University of Alaska Fairbanks (UAF) and DEC. Each village was given the option of using various palliatives or water to control the dust during the summer months and a sprayer for product/water application that would be adaptable for use on the back of a truck or pulled behind an ATV. DEC continues to work with the EPA, DOT, UAF, and tribal communities to find suitable palliatives and improve techniques and technologies for their application. UAF has increased outreach and education about proper road maintenance. In recent years DEC has also increased emphasis on road dust prevention by encouraging communities to work on public education and local speed control on unpaved roads.
DEC designed a road dust study for Bethel for the spring/summer of 2025 that intends to investigate not only the level of PM10 generated from road dust along a busy unpaved road, but also the portion of PM2.5 in the local road dust. Previous local studies utilizing a TSI DustTrak™ have indicated a very high component of fine particulates in road dust in multiple locations in Bethel.
7.3 Carbon Monoxide (CO)
Alaska’s two largest communities, Anchorage and Fairbanks, were designated non-attainment for carbon monoxide (CO) in the mid to late 1980s. Motor vehicle CO emissions increase in the cold winter temperatures experienced in Alaska. These elevated emissions combined with strong wintertime temperature inversions resulted in both communities exceeding the CO standards numerous times each winter. Anchorage and Fairbanks were both initially designated as Moderate Non-attainment for CO and, later in 1996, re-designated as Serious Non-attainment after failing to reach attainment in the allotted time frame. Despite implementation of effective vehicle inspection and maintenance programs and other local air quality control strategies, neither community would have been able to reach attainment without the significant improvements in automobile emission controls that have been mandated by EPA in new vehicles over the past three decades. Neither community has had a violation of the CO standard since 1999. Both communities requested re-designation to attainment and were reclassified as Limited Maintenance Areas in 2004. The EPA approved the second 10-year LMP for Fairbanks on February 22, 201326 and for Anchorage on July 13, 201127 with amendments from March 3, 2014. In 2025, DEC plans to discontinue CO monitoring in Anchorage pending EPA approval of a State Implementation Plan modification that removes the monitoring requirement and concludes the second 10-year LMP period for Anchorage.
7.4 Lead Monitoring (Pb)
To meet source-oriented lead monitoring requirements and after consultation with the EPA, DEC decided to pursue a modeling demonstration to show that lead concentrations at the ambient boundary of the Red Dog Mine meet EPA’s 2008 lead standard. On August 11, 2016, approved the State of Alaska’s waiver request for lead monitoring at Red Dog Mine based on the results of dispersion modeling. The results of the modeling showed that the maximum ambient air three-month rolling average lead concentration at the mine boundary did not exceed 50 percent of the lead NAAQS. Pursuant to 40 CFR Part 58 Appendix D, section 4.5(a)(ii), this waiver must be renewed every five years as part of the Alaska 5-year Air Monitoring Network Assessment. Teck Alaska Inc., the operator of Red Dog Mine, submitted an updated modeling analysis in 2020, leading to a subsequent waiver approval in 2021. DEC began working with Teck and EPA in 2024 to renew the waiver to coincide with the 5-year Network Assessment. Updated modeling inputs continue to demonstrate the facility does not contribute to lead concentrations in ambient air in excess of 50% of the standard. In June of 2025, DEC reviewed and approved of the modeling and analysis performed by Teck and subsequently submitted the documentation to EPA Region 10 in late June 2025 for preliminary review. At the request of EPA Region 10, DEC included the official waiver renewal request in the 2025 Annual Network Plan (ANP) and expects an official response to the request as part of the ANP approval letter in Fall of 2025. A copy of the previous EPA approval letters from 2016 & 2021, and subsequent future approvals can be found at https://dec.alaska.gov/air/air-monitoring/guidance/waivers/.
7.5 Ozone Monitoring (O3)
The revision of the national ozone standard on March 27, 2008, required the State of Alaska to establish an O3 monitoring program by April 1, 2010. The regulation required at least one State and Local Air Monitoring Stations (SLAMS) O3 site in a CBSA with a population greater than 350,000. The Anchorage/Mat-Su Valley population forms the only combined Metropolitan Statistical Area (MSA) in the State of Alaska which meets the criteria. Ozone monitoring was performed in Anchorage, Wasilla and Palmer. The concentrations measured in Anchorage and the Mat-Su Valley are consistently lower than the National Park Service Denali site (considered a clean background site), indicating that Southcentral Alaska does not experience net ozone production but rather ozone scavenging below the natural background levels. To focus sparse resources on pollutants of interest, DEC requested a monitoring waiver for ozone in the Anchorage MSA. The EPA granted a 5-year waiver on October 15, 2018. On October 30th, 2023, the EPA approved a 5-year waiver extension that is valid through October 2028. The EPA concurred with the DEC’s assessment that ozone levels within the MSA remain well below 80% of the NAAQS and there is a low likelihood of exceedances. Ozone monitoring continues at the Fairbanks NCORE site. In order to maintain compliance with national requirements and standards, DEC is updating the ozone transfer standard calibrations to the new ozone absorption cross-section value in 202528.
7.6 Sulfur Dioxide Monitoring (SO2)
Sulfur dioxide monitoring occurs at the Fairbanks NCORE site and in North Pole at the Hurst Road site. The Hurst Road site was added to the network to support the Fairbanks North Star Borough (FNSB) PM2.5 non-attainment area SIP development and enhance understanding of the role of SO2 and sulfate in the secondary formation of PM2.5 locally. None of the emission sources, industrial as well as residential, emit sufficient SO2 to require monitoring.
7.7 Nitrogen Oxide Monitoring (NO2)
DEC currently does not monitor for NO2. None of the emission sources, industrial as well as residential, emit sufficient NO2 to require monitoring. Even with the 2010 revision to the NO2 standard and introduction of the 1-hour NO2 standard, DEC does not expect to see any elevated ambient levels.
8 Alaska’s Air Quality Summary
The following section summarizes data and trends for each of the criteria pollutants monitored in the Alaska Air Monitoring Network in order of pollutants of concern, (i.e. PM2.5, PM10, CO, O3, SO2, NO2)29. The monitoring network currently includes long-term sites in the urbanized areas of Anchorage, Fairbanks, Juneau, and the Mat-SuValley.
8.1 Fine Particulate Matter (PM2.5)
8.1.1 24-hour PM2.5 Concentrations
Fine particulate matter (PM2.5) is the main pollutant of concern in Alaska. PM2.5 particles are largely the result of combustion processes e.g., home heating, wildfires, automobile exhaust, etc. A network of monitors was installed statewide in 1999 following the promulgation of the fine particulate matter standard in 1997. Alaska monitoring network sites have recorded an increase in concentrations in excess of the PM2.5 NAAQS, especially after December 2006, when the 24-hour PM2.5 standard was strengthened from 65 μg/m3 to 35 μg/m3.
A large area in the FNSB was designated non-attainment for the 24-hour PM2.5 standard in December 2009. The Hurst Road site (formerly named the North Pole Fire Station #3 site) is currently one of the highest reading PM2.5 sites in the nation, although concentrations have decreased steadily over the last few years. The high concentrations measured at this site determine the design value for the entire non-attainment area. In 2024, the EPA lowered the PM2.5 annual standard from 12.0 μg/m3 to 9.0 μg/m3. Upon analysis and removal of exceptional events, Alaska met this new standard of 9.0 μg/m3 in all areas except for the Hurst Road site. The inability to meet the annual standard at Hurst Road is directly tied to the wintertime air quality events that affect the 24-hour standard. The same wintertime inversion events that trap particulate matter below the temperature inversion cause the elevated values that impact the annual standard. These issues are actively being addressed in the Fairbanks non-attainment area and reduction efforts to meet the 24-hour PM2.5 NAAQS will also lower the annual standard.
The following charts and tables summarize PM2.5 data from monitoring sites operated by DEC throughout the state. These data exclude measurements of exceptional events. Additional site details are contained in the 2024 Network Plan30. Note that A-Street design values from 2020-2023 are not valid due to data completeness criteria not being met.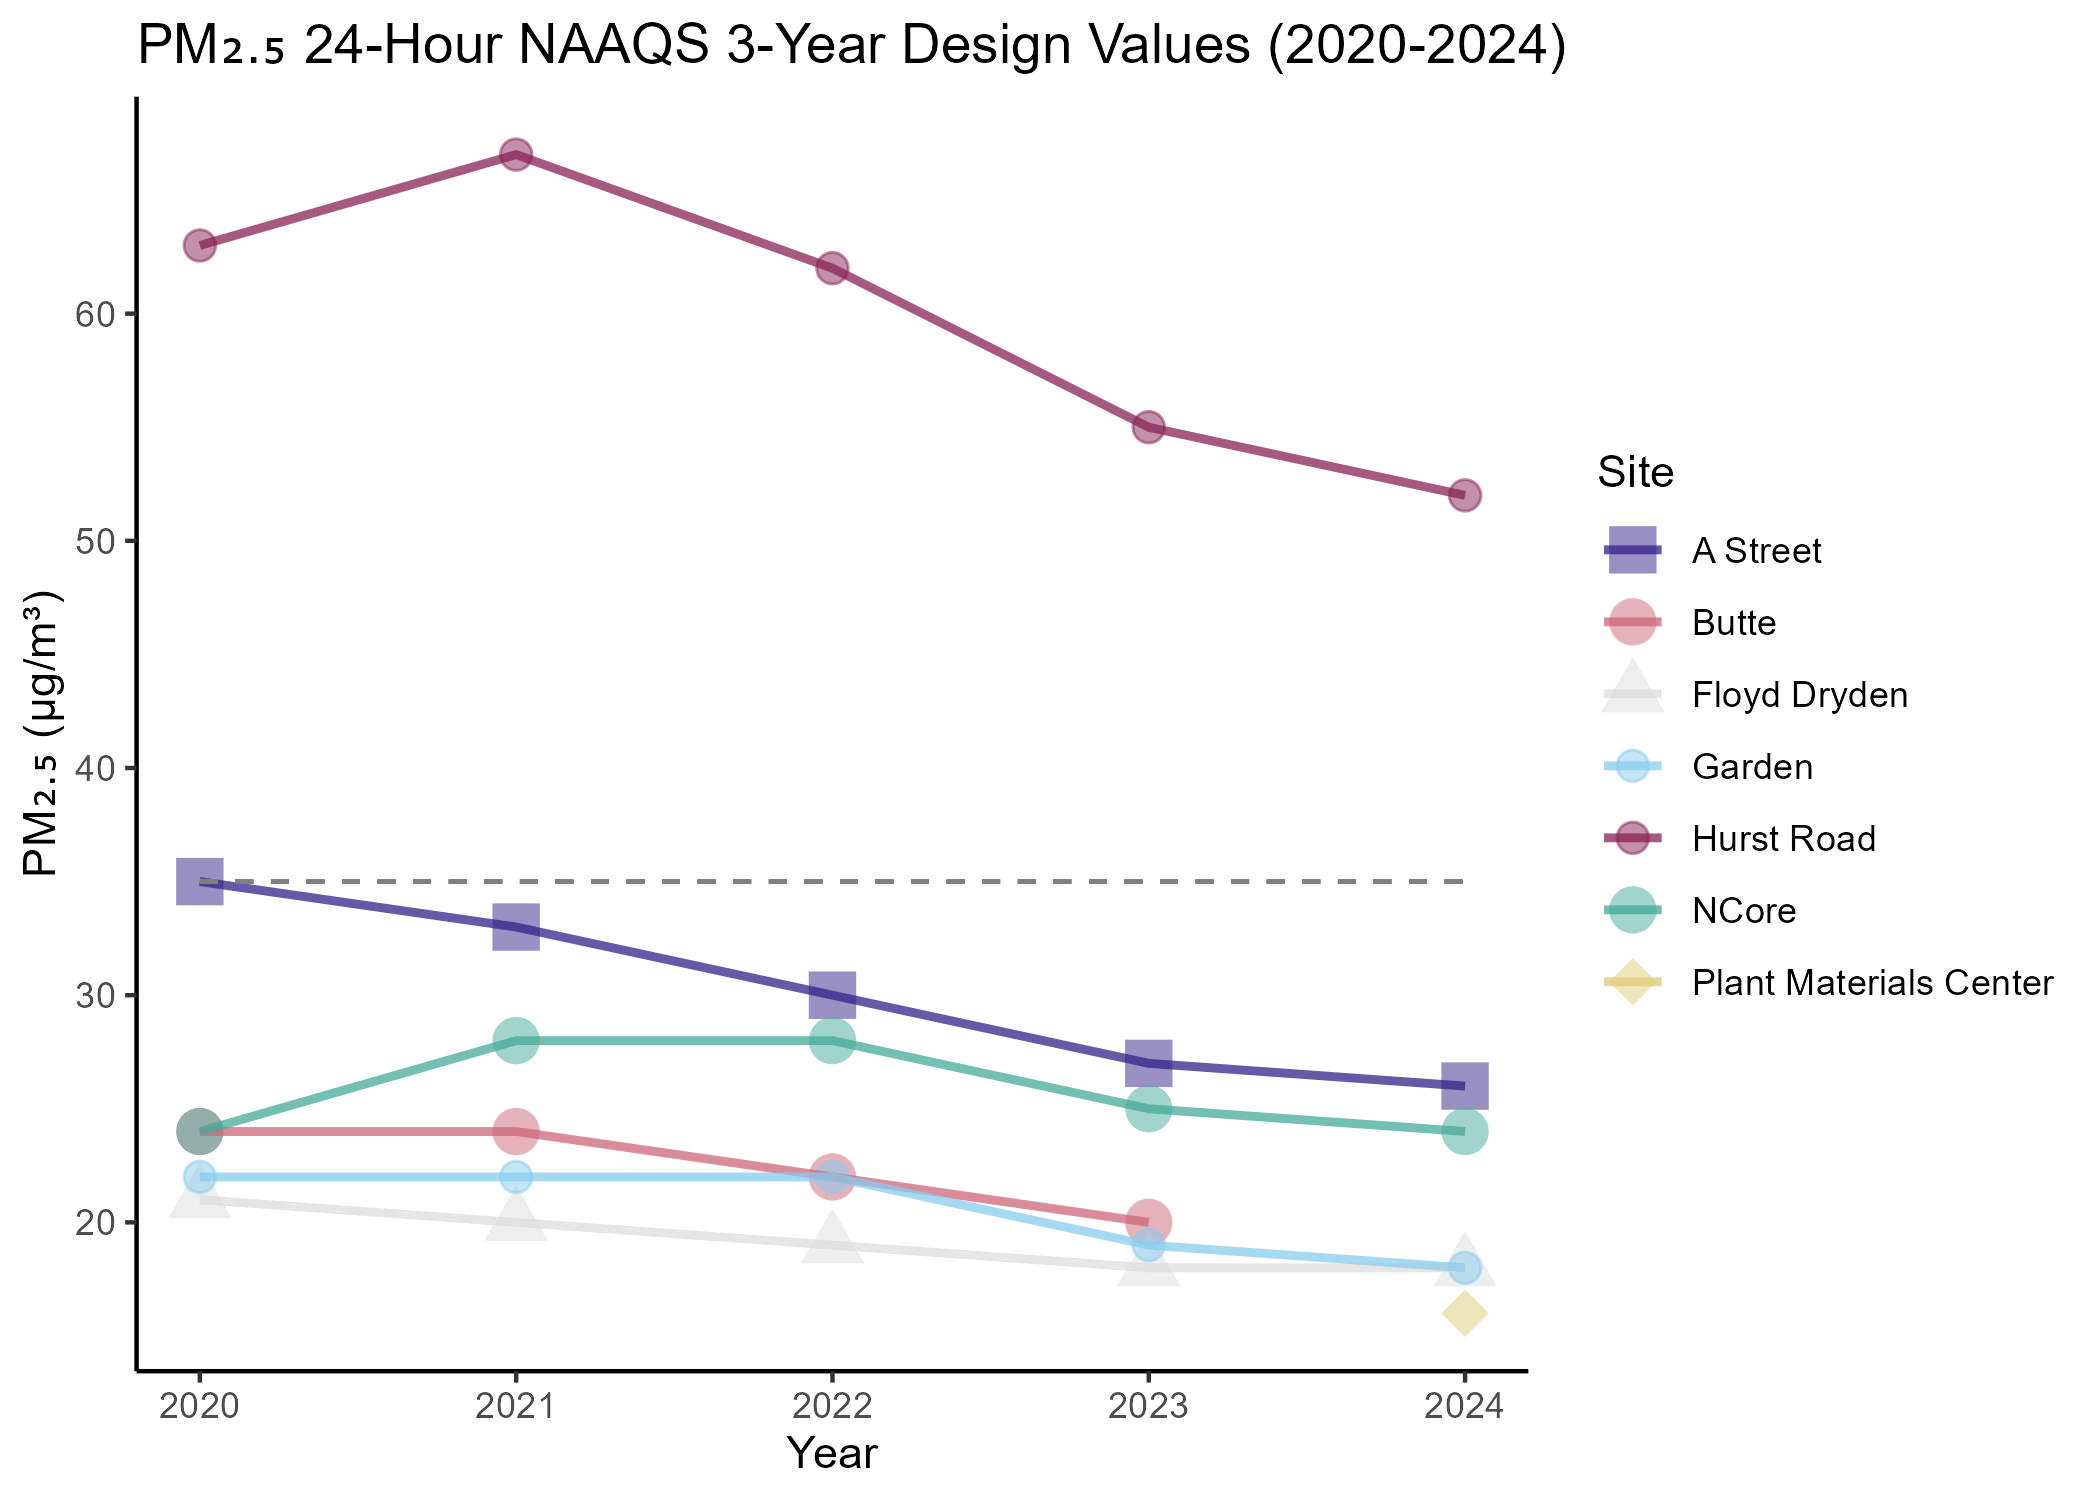
Figure 8. 24-hour PM2.5 3-year Design Values (2020-2024) excluding exceptional events. Dashed line represents 24-hour PM2.5 NAAQS of 35 μg/m3.
| Monitoring Site | AQS ID | 2020 | 2021 | 2022 | 2023 | 2024 |
|---|---|---|---|---|---|---|
| Garden (Anchorage) | 02-020-0018 |
27 (22.2) |
28 (18.7) |
22 (24.0) |
19 (14.2) |
18 (16.8) |
| NCORE (Fairbanks) | 02-090-0034 |
27 (26.6) |
27.3 (27.5) |
27.7 (29.1) |
25.5 (20.0) |
24.1 (23.1) |
| Hurst Road (North Pole) | 02-090-0035 |
68 (71.4) |
72 (65.5) |
62.7 (51.2) |
55.2 (51.9) |
52.4 (54.0) |
| A-Street (Fairbanks) | 02-090-0040 |
N/A32 (36.1) |
3333 (29.6)34 |
30.035 (24.2) |
27.236 (27.8) |
25.7 (25.0) |
| Floyd Dryden (Juneau) | 02-110-0004 |
21 (17.2) |
20 (17.0) |
19 (22.1) |
18 (15.9) |
18.9 (16.9) |
| Harrison Ct., Butte (Mat-Su) | 02-170-0008 |
24 (24.0) |
24 (21.2) |
22 (21.2) |
20 (17.5) |
N/A37 |
| Plant Materials Center (Mat-Su) | 02-170-0010 | N/A | N/A | N/A | N/A |
N/A38 (16.2) |
In addition to wintertime pollution, summertime wildland fire smoke creates PM2.5 pollution statewide most years. While most of these fires are not controllable and the state is not penalized for the pollution, wildland fire smoke poses a significant public health threat. DEC issues air quality advisories statewide during periods when wildland fire smoke impacts air quality. Figure 9 shows the number of PM2.5 exceedances at each site between 2020 and 2024 due to natural events (wildfires). Only A Street, Hurst Road, and NCORE had exceedances due to wildfires.
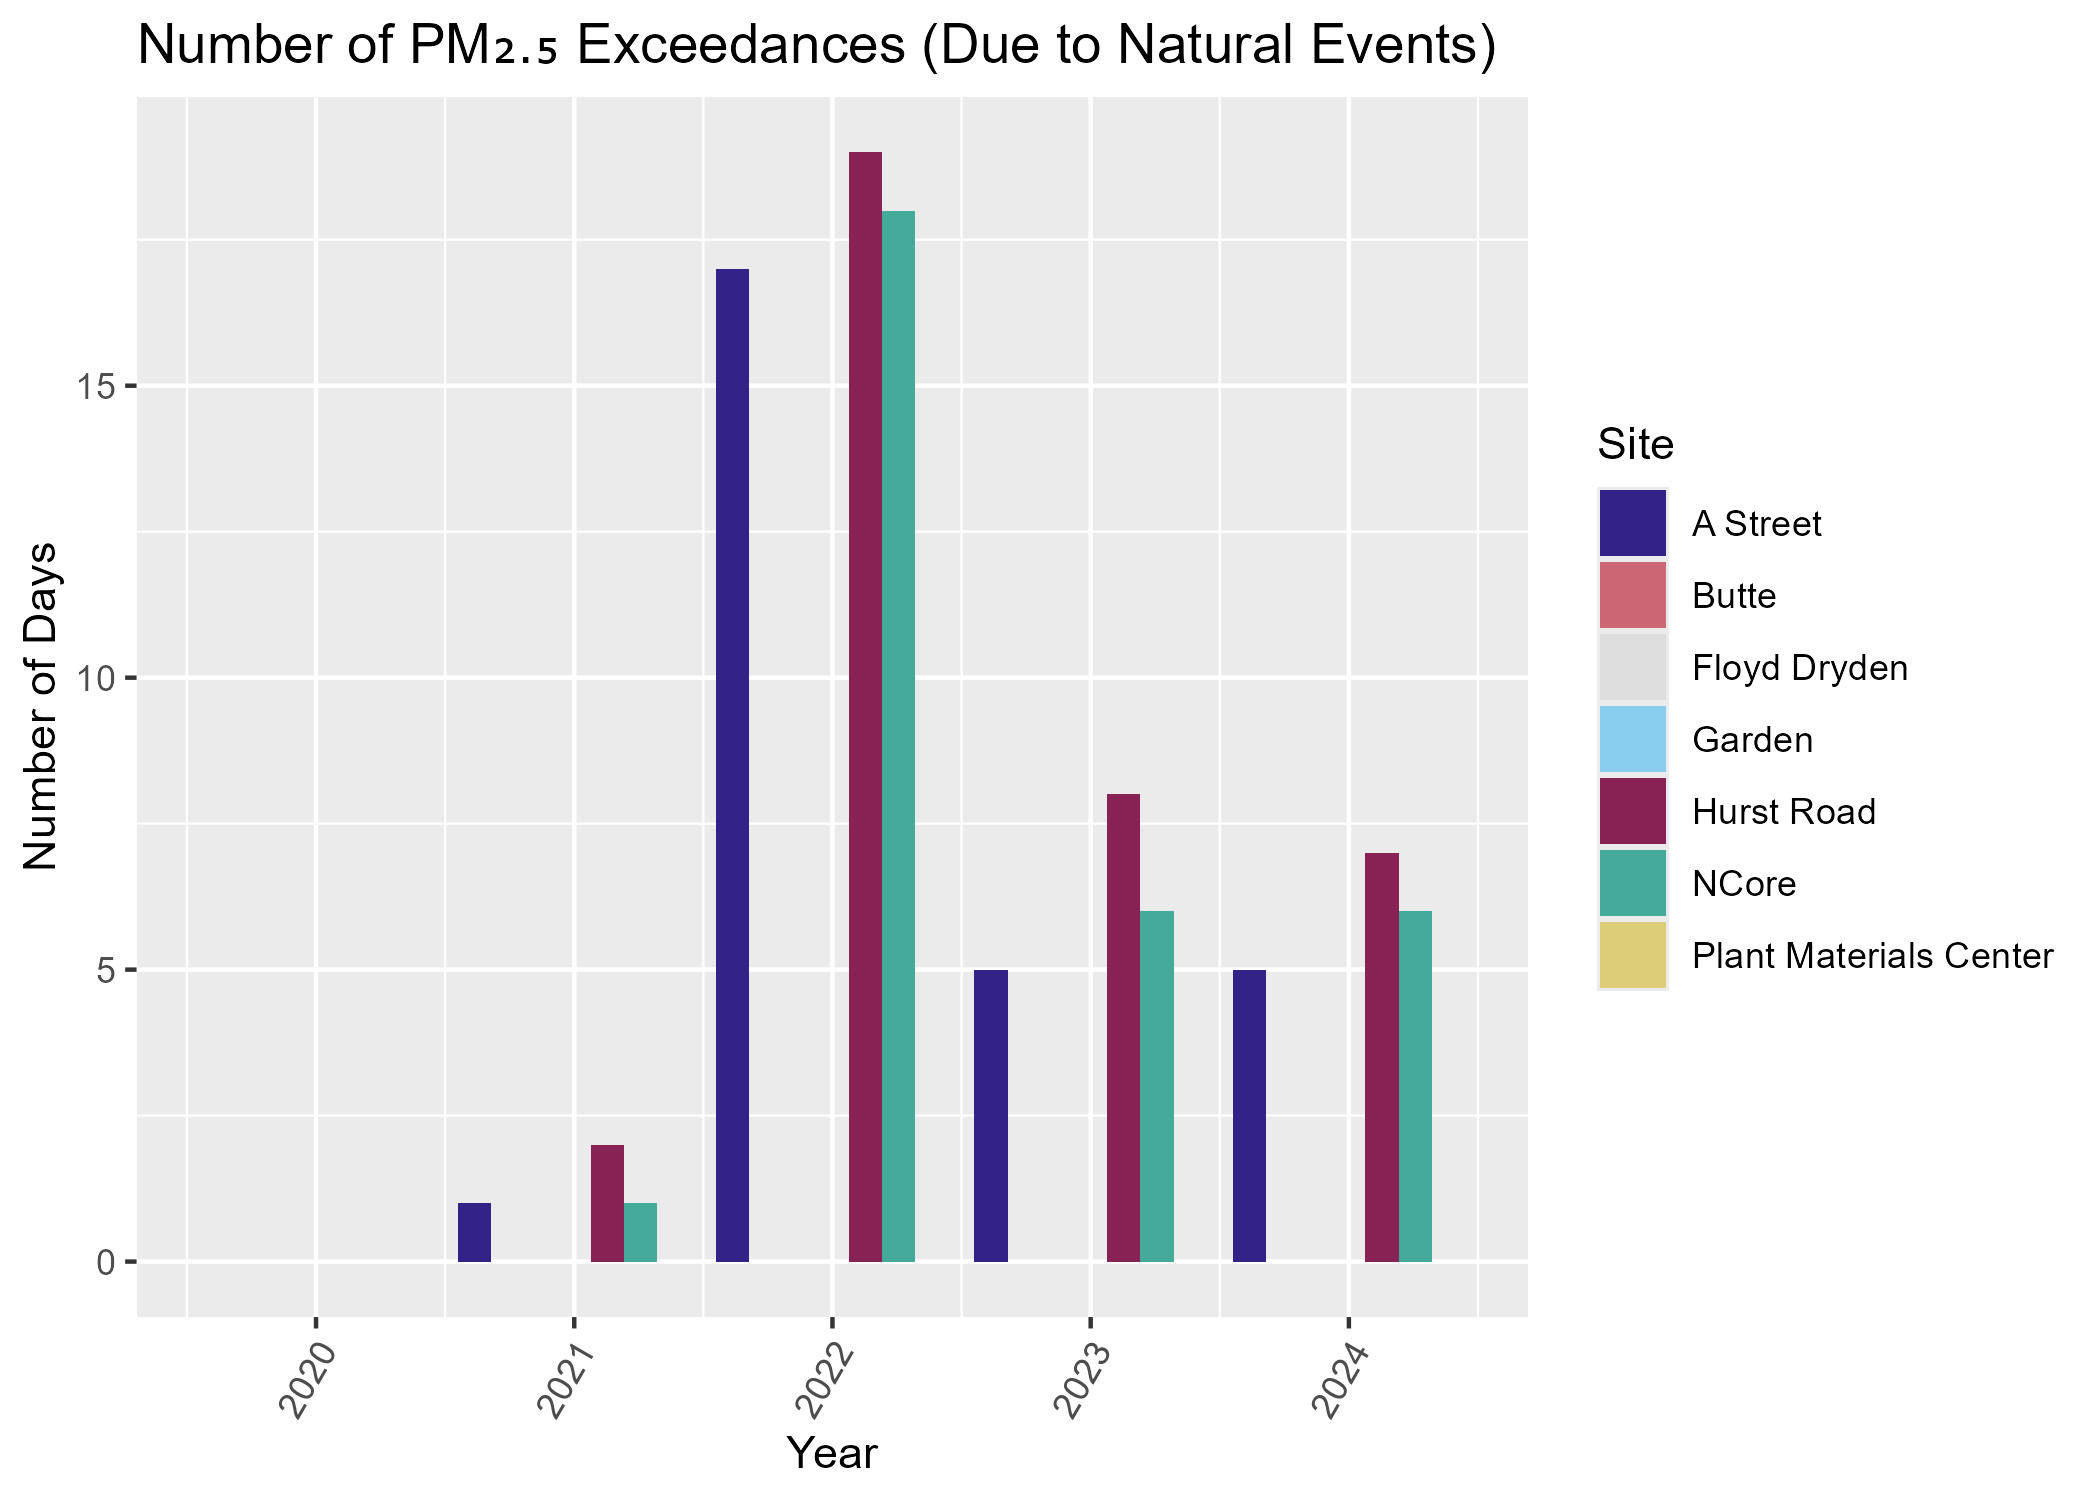
Figure 9. 24-hour PM2.5 exceedance days due to natural events
8.1.2 Annual PM2.5 Trends
The annual PM2.5 3-year design values across the state have been relatively stable or decreasing (Figure 8). North Pole and Fairbanks have the highest annual average design values while the other parts of the state are generally below 7 μg/m3. Note that A-Street graphed design values in 2020-2023 do not meet completeness criteria and therefore are not valid design values.
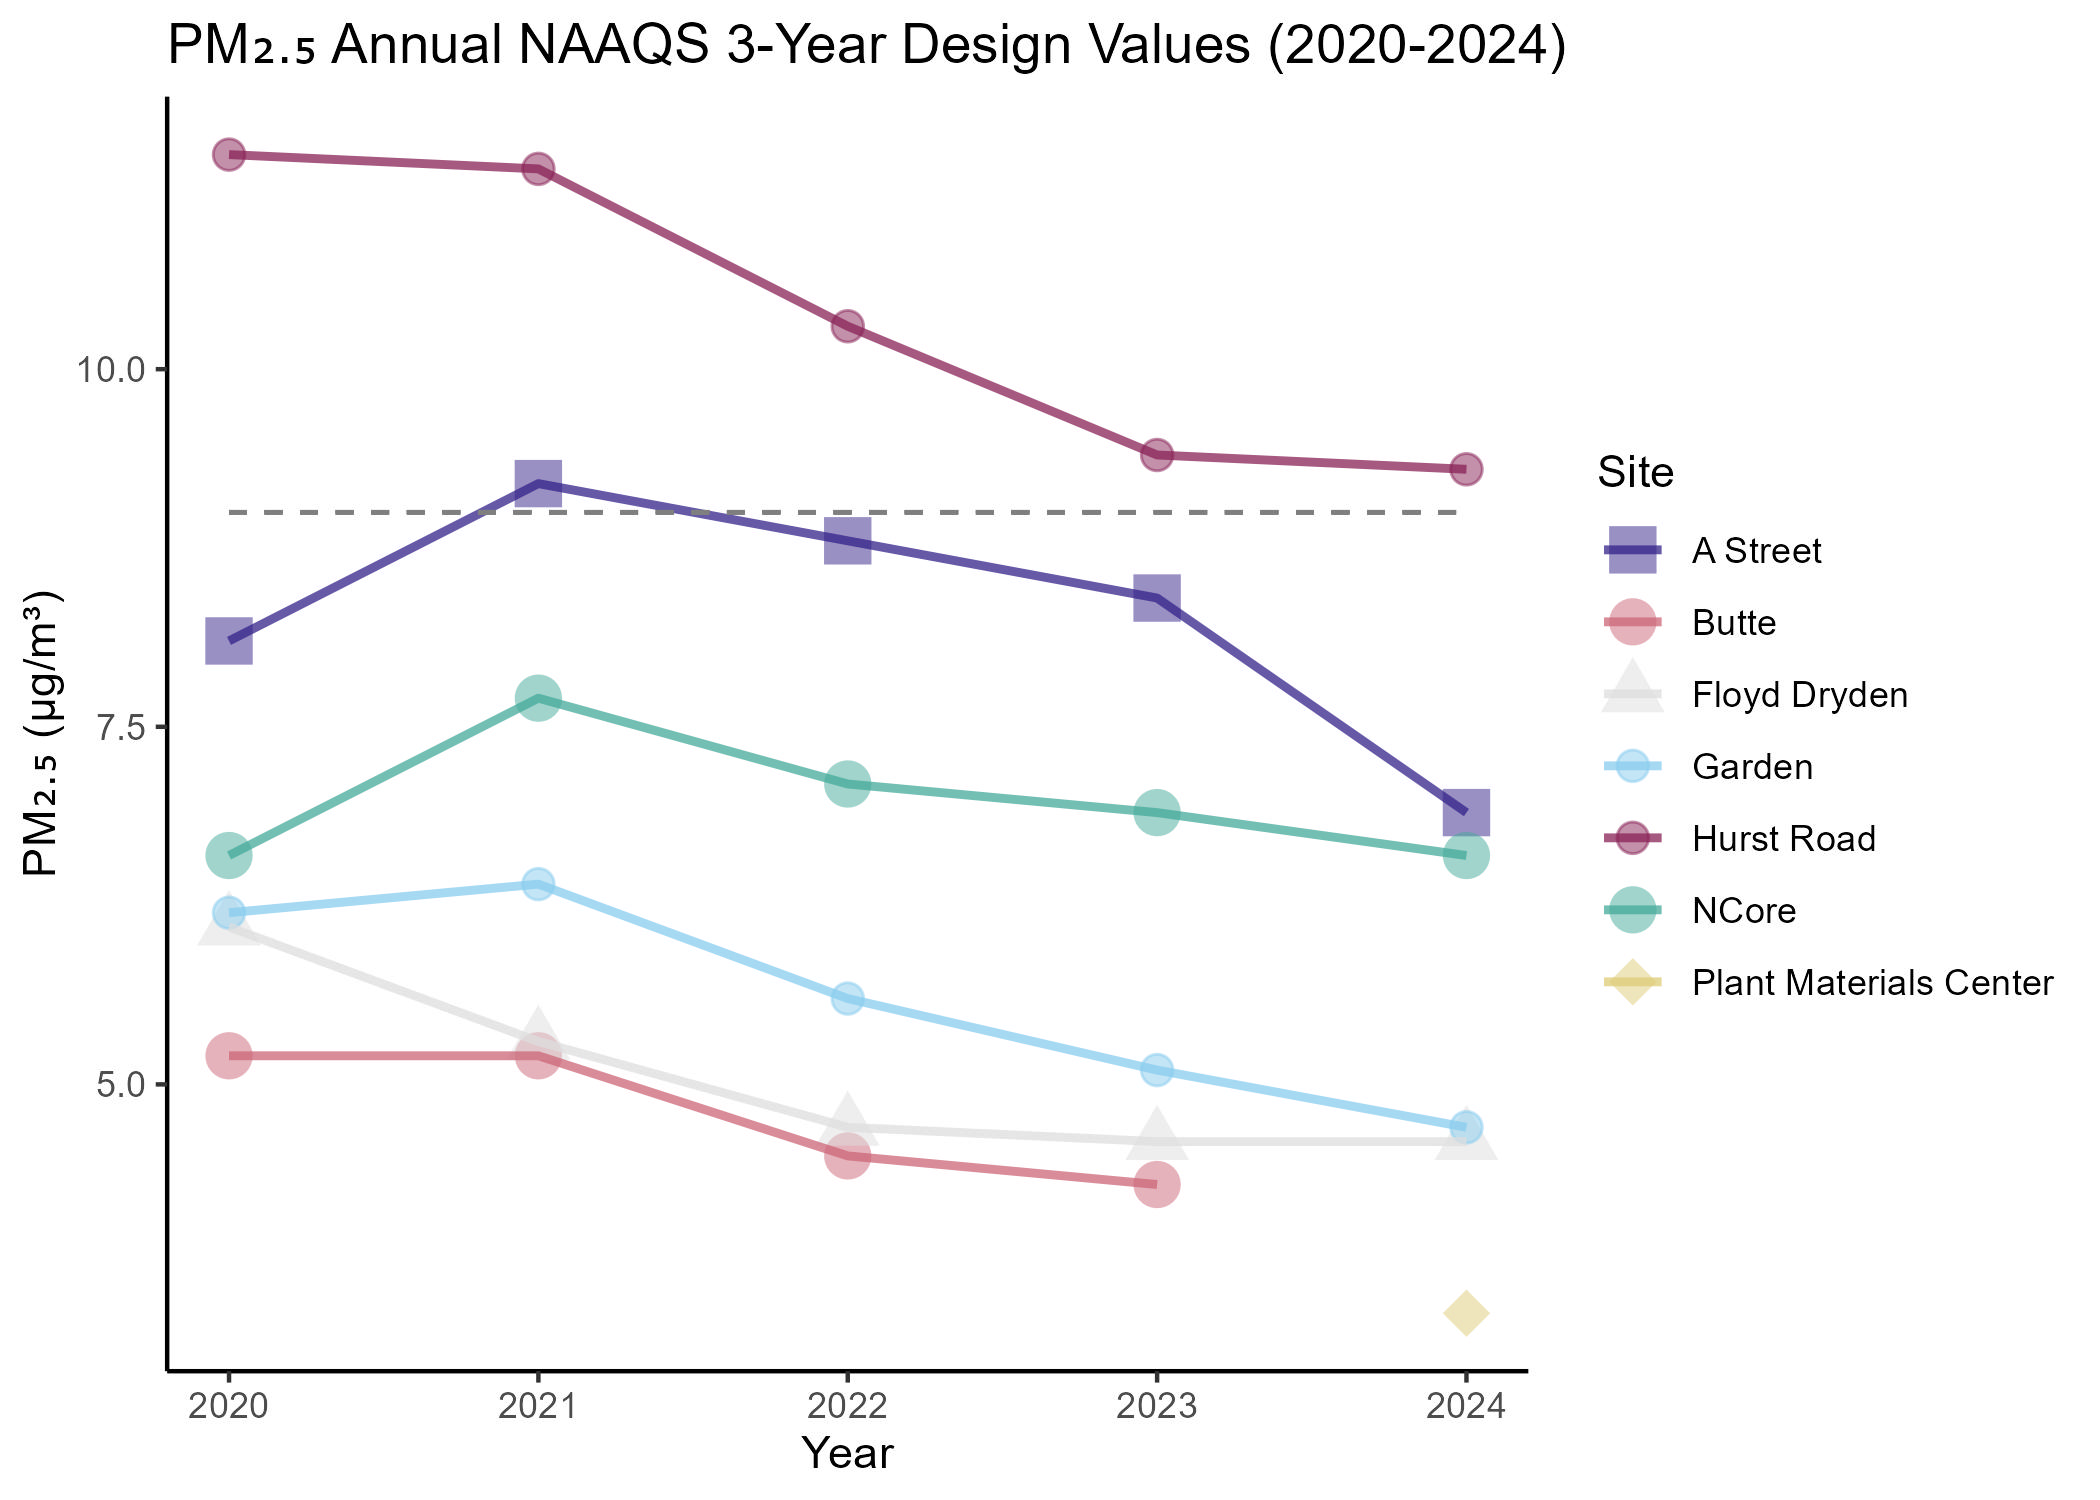
Figure 10. PM2.5 annual average 3-year design values (2020-2024). Dashed line represents annual PM2.5 NAAQS of 9 μg/m3.
| Monitoring Site | AQS ID | 2020 | 2021 | 2022 | 2023 | 2024 |
|---|---|---|---|---|---|---|
| Garden (Anchorage) | 02-020-0018 |
6.5 (5.9) |
6.7 (6.0) |
5.6 (4.9) |
5.1 (4.2) |
4.7 (5.0) |
| NCORE (Fairbanks) | 02-090-0034 |
7.6 (7.2) |
7.7 (7.5) |
7.2 (6.7) |
6.9 (6.4) |
6.6 (6.8) |
| Hurst Road (North Pole) | 02-090-0035 |
11.5 (12.1) |
11.4 (10.7) |
10.4 (8.2) |
9.5 (9.5) |
9.3 (10.3) |
| A Street (Fairbanks) | 02-090-0040 |
8.140 (8.3) |
8.641 (12.042) |
9.943 (6.7) |
8.544 (7.0) |
6.9 (7.0) |
| Floyd Dryden (Juneau) | 02-110-0004 |
6.1 (4.8) |
5.3 (4.4) |
4.7 (4.8) |
4.6 (4.7) |
4.6 (4.5) |
| Butte (Mat-Su) | 02-170-0008 |
5.2 (4.6) |
5.2 (4.4) |
4.5 (4.4) |
4.3 (4.1) |
N/A45 |
| Plant Materials Center (Mat-Su) | 02-170-0010 | N/A | N/A | N/A | N/A |
N/A46 (3.8) |
8.2 Coarse Particulate Matter (PM10)
Although DEC’s monitoring focus has shifted to PM2.5, Alaska has remained aware of PM10 impacts due to natural events as well as human-caused road dust in rural villages and spring road sweeping in the Muncipality of Anchorage. Exposed glacial river beds combined with gap winds through mountain passes have caused several natural PM10 exceedances each year on average in the past. Since 2020, there were only three PM10 exceedances in Alaska, all of which occurred at the NCORE site, two in 2022 and one in 2023. Wildfires were prevalent in the FNSB area in the summer of 2022, 2023 and 2024 and there were ongoing wildfires during the PM10 exceedances at NCORE in 2022 and 2023.
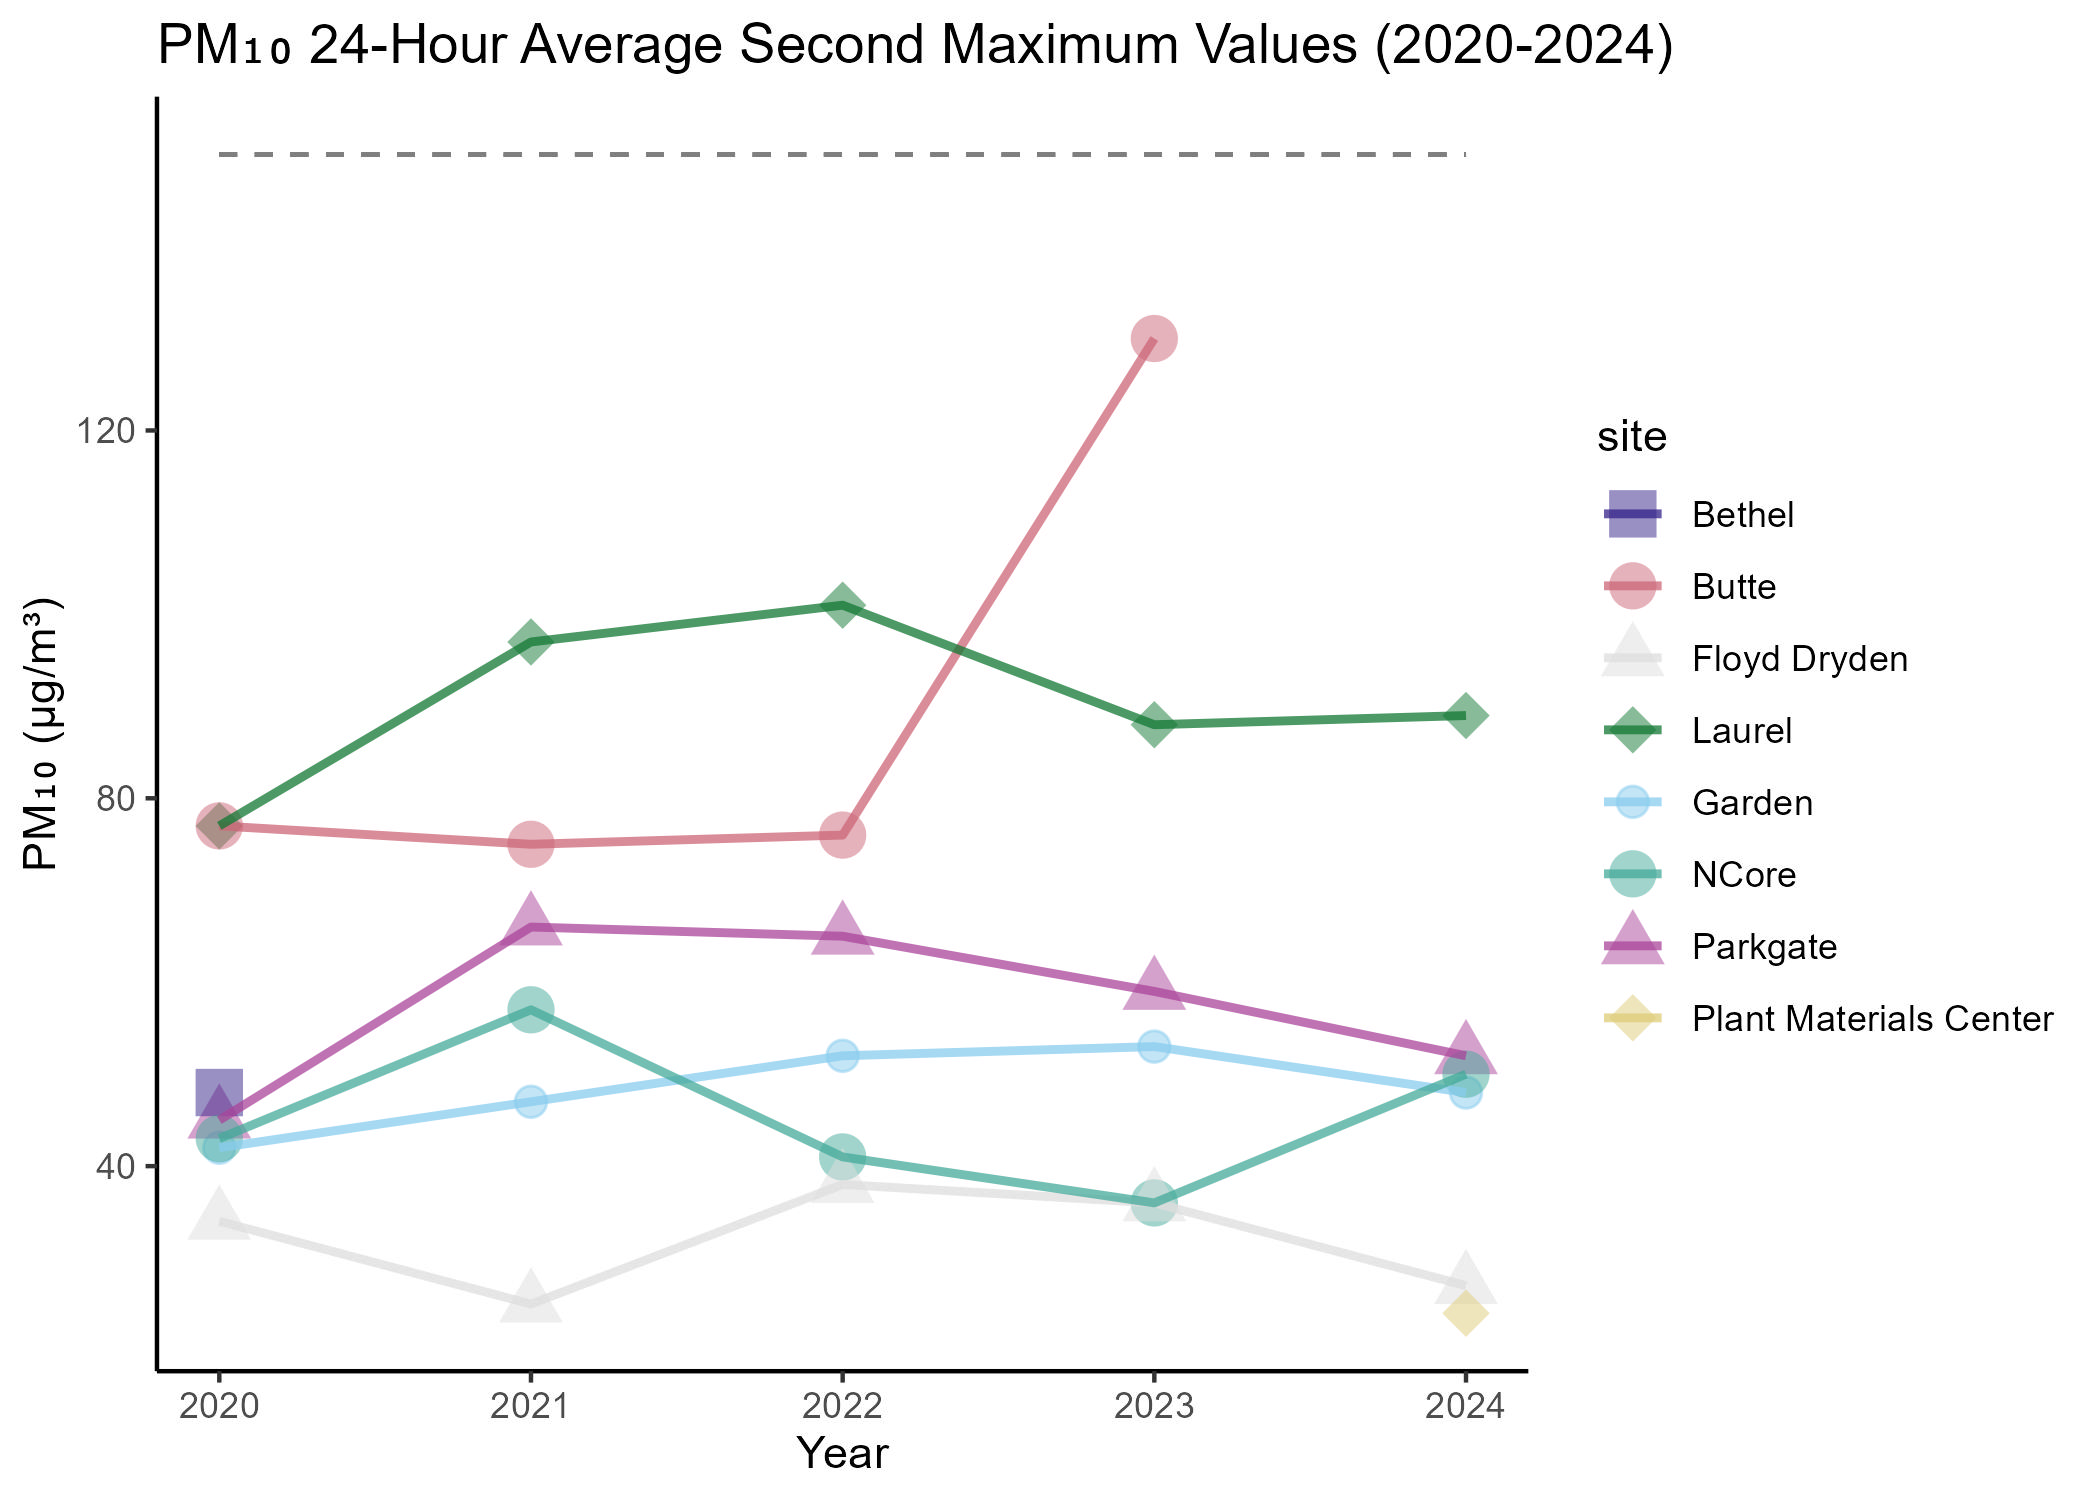
Figure 11. PM10 24-hour average 2nd maximum values (2020-2024). The second maximum values at NCORE are the second maximum values on non-wildfire impacted days, so for 2022, 2023 and 2024 these second maximum values do not match the second maximum value listed by EPA in the AMP440 report. Dashed line represents 24-hour PM10 NAAQS of 150 μg/m3.
Table 5summarizes PM10 data from monitoring sites around the state. These data exclude measurements of exceptional events. Additional site details are contained in the 2024 Annual Network Plan47.
| Monitoring Site | AQS ID | 2020 | 2021 | 2022 | 2023 | 2024 |
|---|---|---|---|---|---|---|
| Garden (Anchorage) | 02-020-0018 | 43 / 42 | 49 / 47 | 57 / 52 | 59 / 53 | 63 / 57 |
| Laurel (Anchorage) | 02-020-0045 | 80 / 77 | 108 / 97 | 103 / 101 | 95 / 88 | 134 / 106 |
| Parkgate (Eagle River) | 02-020-1004 | 56 / 45 | 125 / 66 | 77 / 65 | 59 /59 | 54 / 52 |
| Bethel (Bethel) | 02-050-0001 | 66 / 48 | N/A | N/A | N/A | N/A |
| NCORE (Fairbanks) | 02-090-0034 | 55 / 43 | 70 / 57 | 243 / 171 | 170 / 138 | 233 / 113 |
| Floyd Dryden (Juneau) | 02-110-0004 | 35 / 34 | 28 / 25 | 38 / 38 | 44 / 36 | 32 / 29 |
| Butte (Mat-Su) | 02-170-0008 | 84 / 77 | 92 / 75 | 90 / 76 | 132 / 130 | N/A |
| Plant Materials Center (Mat-Su) | 02-170-0012 | N/A | N/A | N/A | N/A | 118 / 78 |
8.3 CO Summary
Alaska’s two largest communities, the Municipality of Anchorage and the FNSB, were reclassified as Limited Maintenance Plan areas for CO in 2004 and updated, second 10-year Limited Maintenance Plans were submitted in 2014. CO has been measured in the Municipality of Anchorage and the FNSB since 1972. Since 2002, there have been no exceedances of the 8-hour (9 ppm) or 1-hour (35 ppm) CO NAAQS in either community. In 2025, DEC will cease monitoring CO in Anchorage pending EPA approval of a SIP modification that removes the requirement. The approval to end monitoring in Anchorage is based on the monitor showing attainment during the past five years and having a probability of less than 10% of exceeding 80% of the CO NAAQS over the next three years.
| Monitoring Site | AQS ID | 2020 | 2021 | 2022 | 2023 | 2024 |
|---|---|---|---|---|---|---|
| Garden (Anchorage) | 02-020-0018 | 3.2 / 3.0 | 2.2 / 2.2 | 2.5 / 2.4 | 2.6 / 2.4 | 3.1 / 2.7 |
| NCORE (Fairbanks) | 02-090-0034 | 1.9 / 1.7 | 1.8 / 1.5 | 2.8 / 2.5 | 2.3 / 1.9 | 3.2 / 2.1 |
8.4 O3 Summary
DEC currently only monitors O3 at the NCORE site in the FNSB. The monthly average of the maximum hourly ozone concentrations per day are highest in March to May and lowest in November to January. Ozone values are consistently below the 8-hour NAAQS of 0.070 ppm (Table 5).
| Monitoring Site | AQS ID | 2020 | 2021 | 2022 | 2023 | 2024 |
|---|---|---|---|---|---|---|
| NCORE (Fairbanks) | 02-090-0034 |
0.043 (0.043 49 ) |
0.045 (0.046) |
0.048 (0.055) |
0.050 (0.050) |
0.052 (0.052) |
8.5 SO2 Summary
DEC currently monitors SO2 at the NCORE and Hurst Road sites in the FNSB. At NCORE trends are somewhat consistent among years with highest concentrations measured in December-February and lowest concentrations measured in August and September. In 2023 and 2024 there was less variability in measured SO2 concentrations and lower maximum values. SO2 concentrations did not follow a clear trend at Hurst Road. In September 2022, SIP regulations were enacted that banned the selling or use of fuel oil containing more than 1,000 ppm sulfur within the FNSB Non-attainment area50 . This regulation resulted in a swap from #2 heating fuel to #1 heating oil, which may explain the lower variability and maximum values. All 1-hour concentrations measured at both sites fall well below the NAAQS of 75 ppb (Table 5). The annual 99th percentile has never exceeded 50% of the NAAQS at either site.
8.6 NO2 Summary
DEC monitored NO2 at the NCORE site in the FNSB between July 1, 2014 and October 1, 2019. DEC currently only monitors for NO and NOy as per NCORE site requirements.
9 Alaska’s Air Quality Monitoring Network Technology Results & Discussion
9.1 Technology
9.1.1 Particulate Matter
As sampling equipment has aged and reached the end of its service life over the past several years, DEC was able to secure funding to replace many of the samplers needed to keep the network operating smoothly. Rather than direct replacement of the equipment, changes to the network required some shifting of resources and equipment types to meet our monitoring objectives and ensure adequate data capture. For continuity and for lack of proven alternatives, monitoring stations have continued to feature semi-continuous Met One Beta Attenuation Monitor (BAM) 1020 monitors for PM10 and PM2.5. These operate primarily as Federal Equivalent Method (FEM) monitors within the network. In previous years, DEC elected to operate the BAM 1020 monitors as near-FEM quality within the FNSB non-attainment area by replacing the Very Sharp Cut Cyclones (VSCC) with Sharp Cut Cyclones (SCC) after discussions with EPA concerning the BAM 1020’s ability to consistently meet Class III FEM performance criteria in the extreme FNSB climate. As PM2.5 measurement technologies have improved, DEC has noted reduced bias compared to previously observed values when compared to Federal Reference Method (FRM) samplers during elevated biomass particulate events. As a result, the SCCs on the A-Street and NCORE PM2.5 BAMs have been replaced with VSCCs, returning them to FEM quality.
DEC continues to utilize Thermo Scientific (Thermo) 2025i and 2000i FRM samplers. 2025i samplers are utilized as the primary samplers in Fairbanks and Juneau. The PM2.5 collocated 2000i at Butte and the PM10 collocated 2000i at Parkgate were relocated to Garden. DEC noted several shuttling issues with the 2025i Partisols during routine wintertime cold snaps in the FNSB non-attainment area. DEC transitioned the sample filter cassettes from blue polypropylene to white Delrin to mitigate material elasticity in the extreme cold temperatures.
In Juneau, the T640x replaced the PM10 and PM2.5 BAMs at the Floyd Dryden site. Following concerns regarding performance of the T640x in areas with a high woodsmoke component, a national ‘data alignment’ (or correction factor) was released. EPA applied the correction factor to all unaligned data prior to 2024. DEC has opted to not implement the correction factor and installed an FRM 2025i as the primary PM2.5 monitor to ensure the data is not being underrepresented. The T640X PM2.5 is designated as an Special Purpose Monitor (SPM) and from 2024 forward the instrument provides PM2.5 Air Quality Index (AQI) data used for public information and for the City and Borough of Juneau to call burn bans as needed. DEC will continue to use the T640x instrument as a PM10 FEM, since PM10 concentrations have only exceeded 30% of the NAAQS twice in the last three years, there is little risk of missing high pollution events.
A detailed analysis and discussion are provided in the 2025 Annual Network Plan55. The State will continue to employ FRM monitors as the primary samplers at any site where the Class III FEM criteria are not met consistently. Table 5 summarizes the particulate matter sampling technology used at the long-term SLAMS and SPM sites.
The NCORE and Hurst sites house a Met-One Super SASS Speciation Monitor and the URG 3000N Carbon Sampler.
9.1.1.1 PM Calibration and Auditing Equipment
For calibrating low flow PM equipment, both FRM and continuous, DEC uses the Alicat Scientific Alicat FP-25BT reference devices, which are re-certified annually. The State’s air quality auditor maintains separate equipment for the sole purpose of independent quality control checks. The Met One Super SASS speciation sampler and URG 3000N are calibrated and audited with an Alicat FP-25BT.
9.1.2 Gaseous Analyzer Equipment
The NCORE site has a mix of Teledyne and Thermo Scientific trace level analyzers. The Anchorage CO site at Garden operates a Thermo Scientific 48i analyzer. The North Pole Hurst site utilizes a Teledyne T100U analyzer. Table 5 shows a detailed list of the gaseous analyzers and sites.
9.1.2.1 Gaseous Calibration and Auditing Equipment
The monitoring network employs several calibrators and transfer standards to perform routine precision checks, calibrations, and verifications of the gaseous instruments. The NCORE site employs a Teledyne T700U transfer standard, the CO site at Garden utilizes a Thermo Scientific 146iQ calibrator, and the SO2 site at Hurst operates a Teledyne T700 calibrator.
The Fairbanks NCORE, Anchorage Garden, and North Pole Hurst sites each derive zero air for dilution of EPA Protocol gas cylinders, and zero verification and calibration, from Teledyne T701H Zero Air Generators. The DEC QA/QC officer maintains a dedicated transfer standard, and calibration gases for their audits. Zero air is provided through the site zero air generators and is verified against zero air cylinders prior to the audits. Mass flow controllers for all gaseous equipment are verified using Alicat Whispers.
9.1.3 Equipment Replacement Strategy
There are currently six PM2.5 and two PM10 FRM samplers in operation in the network, two Thermo 2000i and six of the 2025i series. The oldest 2000i’s have been in service for approximately six years, however they have a lower service time despite their age due to operating on EPA’s 1-6 schedule. The 2000i’s also rely on simple mechanism that is reliable for longer periods of time with standard maintenance as compared to the 2025i series. They are anticipated to run several more years before they require replacement. Three of the 2025i samplers are less than three years old, with one that is one year old. While most FRM PM samplers have been replaced in the last several years, DEC also has six BAM 1020 instruments (Garden, Laurel, Parkgate, and Plant Materials Center) that have reached the end of their service life and require replacement. DEC received deferred maintenance funding that covered replacement of those instruments in late 2020. DEC has updated the aging 2nd generation BAM 1020s with 3rd generation BAM. (X series is 2018, BN is 2021, FN is 2025). The aging Southcentral BAMs are scheduled to be replaced in 2025.
All NCORE gaseous analyzers, transfer standard, zero air generator, and primary ozone standard were replaced in the summer of 2020. The SO2 and ozone analyzers are Thermo Scientific, with the remainder Teledyne. The Hurst SO2 analyzer was replaced with a Teledyne T100U in 2024. The Garden CO analyzer has reached the end of its service but is not slated to be replaced due to the impending shutdown of CO monitoring pending approval of a SIP amendment that removes the monitoring requirement.
The gravimetric lab in Fairbanks uses a Mettler Toledo balance in a Measurement Technology Laboratories (MTL) AH500 climate controlled Automated Filter Weighing System (FWS) enclosure for all 47mm PM2.5 and PM10 Teflon FRM filters. The lab also uses an MTL Laboratory Information Management System (LIMS), which has been in service in Alaska since approximately 2015 during manual filter weighing activities in Juneau and was upgraded with the purchase of the Fairbanks FWS in 2019. DEC intends to restart a second FWS gravimetric filter lab in Juneau after a new lab space renovation is complete in July 2025. The balances are annually recertified and according to the auditor are in excellent condition. The Fairbanks lab XPR6UD5 balance is about nine years old and has reached the end of DEC’s assigned service life and is intended for replacement in FY26. The Juneau balance is also an XPR6UD5, but only four years old and in excellent condition. Periodic updates of the LIMS occur on an as-available basis.
| # | Parameter | Equipment | Manufacturer | Location | Comments |
|---|---|---|---|---|---|
| 5 | PM2.5 | Partisol 2025i | Thermo Scientific | NCORE, A-Street, Hurst (2), Floyd Dryden | Collocate at Hurst |
| 1 | PM2.5 | Partisol 2000i | Thermo Scientific | Garden | FEM collocate |
| 1 | PM10 | Partisol 2000i | Thermo Scientific | Garden | FEM collocate |
| 5 | PM2.5 | BAM 1020 | Met One | NCORE, A-Street, Hurst, Garden, Plant Materials Center | - |
| 2 | PM2.5 | Super SASS | Met One | NCORE, Hurst | - |
| 2 | PM2.5 | 3000N | URG | NCORE, Hurst | - |
| 5 | PM10 | BAM 1020 | Met One | NCORE, Garden, Plant Materials Center, Parkgate, Laurel | - |
| 1 | PM10/PM2.5 | T640x | Teledyne | Floyd Dryden | - |
| 2 | PM2.5 | BAM 1020 | Met One | Anchorage Lab, Fairbanks Lab | Spare units |
| 2 | PM10 | BAM 1020 | Met One | Anchorage Lab, Fairbanks Lab | Spare units |
| # | Parameter | Equipment | Manufacturer | Location | Comments |
|---|---|---|---|---|---|
| 1 | CO | T300 U | Teledyne | NCORE | - |
| 2 | CO | Thermo 48i | Thermo Scientific | Garden, Spare | - |
| 1 | SO2 | Thermo 43iQ-TL | Thermo Scientific | NCORE | - |
| 1 | SO2 | T100U | Teledyne | Hurst | - |
| 1 | NOy | T200U | Teledyne | NCORE | - |
| 1 | O3 | 49iQ | Thermo Scientific | NCORE | - |
| 2 | Calibrator | T700U | Teledyne | Hurst, NCORE | - |
| 3 | Zero Air Generator | T701H | Teledyne | Garden, Hurst, NCORE | - |
| 2 | O3 | Teledyne 403E | Teledyne | Fairbanks Lab | Spare |
| 1 | Calibrator | 146iQ | Thermo Scientific | Garden | - |
| 1 | Audit Device | T750U | Teledyne | Anchorage Lab | - |
| # | Parameter | Equipment | Manufacturer | Location | Comments |
|---|---|---|---|---|---|
| 1 | Relative Humidity | EE181 | Campbell Scientific | NCORE, Hurst | - |
| 7 | Ambient Temperature | T200 | Met One | NCORE, A-Street, Hurst | - |
| 3 | Wind Speed/Direction | Windbird + Vane Anemometer | R. M. Young | Garden, Floyd Dryden, Plant Materials Center | - |
| 9 | Wind Speed/Direction | Sonic Anemometer 86004 | R.M. Young | NCORE, A-Street, Hurst, Spare | - |
9.2 Data Acquisition and Storage
To manage the large datasets that are produced by continuous analyzers, a data acquisition system is necessary. The data acquisition system consists of a central server that houses all the DEC monitoring data, data loggers that temporarily store monitoring site data and then transfer data to the central server, sensors and sites that communicate directly with the data acquisition system, and a database for viewing, importing/exporting data via variety of channels, configuring data communications, and performing a variety of functions (Figure 12).
DEC currently utilizes Agilaire AirVision software coupled with Agilaire Site Node Loggers and with AVTrend software to continuously receive data from regulatory monitoring sites across the state. Agilaire AirVision software also acts as a data acquisition system for data from other vendors or sites without Site Node Loggers, allowing DEC to integrate data from a variety of instrumentation and sensors from both regulatory and non-regulatory sites. The data acquisition system communicates with the various sensors and instruments through multiple modes of communication including application programming interface (API), file input (upload or file transfer protocol (FTP)), and Modbus network data communications. Data on the AirVision database is then shared with the public on a real-time AQI web map56. DEC also shares the data to EPA’s Air Quality System and AirNow57 for use by the public.
DEC also uses AirVision software as a tool to perform quality assurance/quality control (QA/QC) of the data (both manually and with automated processes), remotely access data to perform error and diagnostic checks of sites, program automated gaseous calibrations, create automated data reports and alerts, and more.
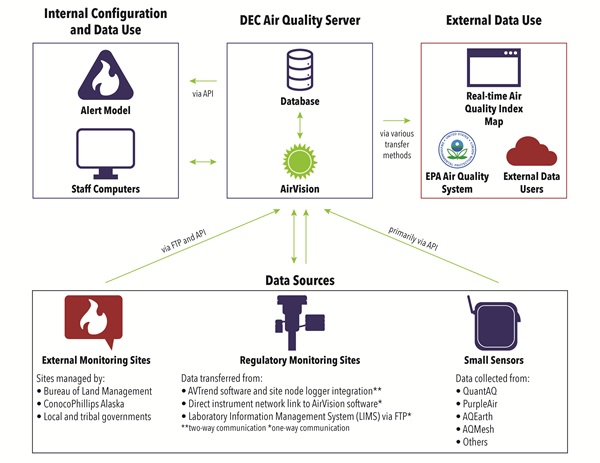
Figure 12. Schematic of Alaska’s DAS : The DEC Air Quality server receives and manages data through the AirVision software and connected database. Data sources that relay data to the AirVision database include external monitoring sites managed by the Bureau of Land Management, ConocoPhillips Alaska, and local and tribal governments. DEC’s regulatory monitoring sites and small sensors, such as QuantAQ, PurpleAir, and others also relay information to the AirVision database. Data from these sources flow into the AirVision database primarily through direct wiring connections, API calls, and FTP connections. DEC staff use the AirVision software to analyze data and information and data can be transferred to external entities, including EPA’s Air Quality System, external data users, and DEC’s real-time Air Quality Index map. Overall, the AirVision system enables both internal configuration and external data use by linking diverse data sources through central processing and distribution.
10 Network Evaluation
A network assessment includes a re-evaluation of the objectives and budget for air monitoring, the evaluation of a network’s effectiveness and efficiency relative to its objectives and costs, and the development of recommendations for network reconfigurations and improvements. The sections below provide a brief assessment of the current network and anticipated improvements planned or strived for in coming years.
10.1 Monitoring Objectives and Budget
DEC’s federal funding has been largely stable over the past five years, but due to the impacts of an inflationary economy affecting costs in most areas, AMQA staff have been asked to stretch those funds further than ever and find additional funding sources and expand monitoring efforts that benefits Alaskans. This includes receiving new grant opportunities provided by the Inflation Reduction Act (IRA) and American Rescue Plan (ARP), while also moving SLAMS expenses under a portion of Title V permitting fees. Shifting SLAMS expenses helps to create a stable source of monitoring funds that help protect the program against budget cuts and diminished purchasing power.
Due to flat federal funding, most of DEC’s regulatory air monitoring activities are focused on population centers and areas that have shown in the past to have air quality problems. The Alaska Department of Labor and Workforce Development projects the highest growth rate within the state to occur in the Mat-Su Borough (15% increase between 2023 and 2035). At one time as many as three monitoring sites used to operate in this area, but currently the only site remaining in the Mat-Su Borough is the Butte area Plant Materials Center (Plant Materials Center) monitoring site (PM2.5, PM10). This site was established on the removal of the Harrison Court location in 2023 at the request of nearby residents due to development plans in an area near the monitoring station, with Plant Materials Center officially coming online and reporting as of January 1st of 2024. DEC also discontinued the Bethel PM10 & PM2.5 SPM in June of 2020 due to increasing QA/QC challenges during COVID-19 and the costs associated with operating a monitoring station in a remote Alaska community. The current statewide monitoring network now consists only of regulatory required monitoring sites. To adapt to the weaker purchasing power that stagnant budgets provide, and continue to expand services to inform residents, DEC continues to develop its community-based air monitoring network of low-cost sensor pods.
Alaska’s Air Monitoring and Quality Assurance Program has a staff of 18 full time positions to cover a large state. As of 2017, DEC is responsible for site operations, data review and analysis, and data submission and reporting for all regulatory ambient monitoring sites in Alaska.
DEC continues to look for efficiencies wherever possible. The network consists of a combination of FRM and FEM monitoring technologies. Wherever instrument performance and data quality allow it, DEC has implemented a shift to automated and real time data collection. DEC also operates non-regulatory Chemical Speciation Network monitors in the Fairbanks non-attainment area. These monitors aid SIP and modeling efforts by identifying arctic climate photochemistry issues and source apportionment trends within the airshed, among other benefits.
The Department received a waiver from EPA of the requirement to monitor for ozone in the Anchorage MSA through October 2028. The area is not expected to see net ozone generation based on the limited emissions of ozone precursors and the sub-arctic latitude that results in a lack of required photochemistry to produce ozone. The cost and effort of ozone monitoring in the Anchorage MSA is not supported by the tight Division budget, especially considering the low probability of measuring values near the health-based standard.
New FEM technology (i.e. automated technologies), as well as the use of a data acquisition system have reduced some of the burden on staff resources, but despite the funding efficiencies implemented within the program, the section continues to experience an ever-increasing workload resulting from a large shift from simple, periodically collected and reviewed sample data, to a vastly growing and changing data landscape fueled by a technology shift including sensor pods, online data reporting, and analysis of huge amounts of data. In the modern air quality landscape, 24-hour data sets have been slowly replaced by hourly data sets, or even 1 minute (or smaller) data intervals. This is compounded by the increasing number of parameters, data, and meta data collected by the analyzers along with the required quality assurance and control (QA/QC) shift the focus from site operations to data display, reduction and reporting. The ever-expanding federal QA/QC requirements translate into additional work for site operators and data analysts, both in terms of sampler maintenance to provide for the required high performance, as well as, the post collection data review, validation and documentation. Additionally, the desire both by the public and EPA to have access to real time quality data online in a clear and intuitive presentation, poses challenges that significantly impact a small program.
Additionally, staff are burdened by complex federally required exceptional event documentation and waiver requests in a state where summer wildland fires and springtime windblown dust events are regular occurrences, rather than the exception, and put an additional strain on a program already stretched thin. DEC has leveraged the use, and relative affordability, of lower cost sensor technology to support our remote communities and areas likely to be impacted by seasonal wildfire smoke. Upkeep, communication, coordination, and large datasets offset some of the savings these networks provide but provide valuable data to our communities that have limited infrastructure, resources, cellular service, power, and internet. Many of the communities statewide, regardless of infrastructure support, are prevented from anything but seasonal use of these sensors due to the inconsistent data quality or reliability at wintertime temperature.
At this point DEC does not foresee the expansion of the existing regulatory network of long-term sites. Due to current budget and staffing constraints, DEC has limited ability to conduct special purpose monitoring. Cost and logistics for these short term projects require close coordination with the local tribal and city governments. DEC regularly receives requests to monitor in small communities throughout the state and needs to strike a balance of investigating community complaints with the need to spread monitoring sites into areas not previously assessed.
10.2 Network Effectiveness and Efficiency
While the monitoring network meets the regulatory requirement in terms of number of monitoring stations and monitored pollutants, it is confined to the population centers and does not adequately describe conditions in outlying and rural communities.
Operation of the regulatory monitoring network is stable and meets all the federal requirements. DEC continues to focus on maintaining the core monitoring site operations and reporting data to the federal air quality database, AQS. DEC has to prioritize these activities while providing more extensive data analysis, reduction and reporting for public consumption. Any additional special studies, special projects, widespread monitoring in smaller communities or emergency monitoring for wildfires or volcanic eruptions are fit in as staff time and funding allow.
The large landmass and minimal infrastructure of Alaska pose unique challenges for monitoring that impact the costs of what would be considered routine monitoring activities elsewhere. While site operators are usually responsible for multiple sites, Alaska’s sites can be many hundreds of miles apart. This means that these sites either have to be managed remotely or that frequent travel is required. Travel to outlying communities or even just beyond the core network is very expensive. Often trips require overnight stays to allow sufficient time to complete tasks associated with setting up new monitoring equipment and training or to troubleshoot malfunctioning equipment. While in recent years, DEC has not been able to expand monitoring into rural communities, staff have focused on cooperation with other state and federal agencies and local governments to leverage resources.
New sensor technology has developed rapidly in recent years. These technologies are seeing increased private use and DEC continually receives public requests seeking guidance on their use and comparing the data collected from these technologies to that which is collected at the regulatory monitoring sites. DEC will need to create more training and networking opportunities for staff to research and keep up with these emerging technologies, like low-cost sensors, and to test their limitations in our harsh climate. As a seasonal particulate matter monitoring network statewide is needed for natural events wildland fire smoke, opportunities lie with new portable, lower cost sensor technology.
There is a need for reliable PM10 portable sensor technology. Road dust is one of the primary pollutants of concern in Alaska, affecting many remote communities. Currently most PM sensors are designed to measure PM2.5 and smaller particles. While they still display PM10 concentrations, they use a scaling algorithm that estimates PM10 concentrations based on the PM2.5 size fraction. Field studies have documented that most of these sensors do not have a satisfactory performance when it comes to PM10. Therefore, in Alaska where these two particulate matter categories have very distinct sources, this technology is not yet appropriate for measuring road dust. DEC routinely receives requests for advice on PM10 instrumentation, and it’s of large interest internally for its own use.
11 Recommendations for Network Reconfigurations and Improvements
Based on the overall low number of industrial sources in the state and the low levels of manmade ambient pollution, DEC does not plan to expand the regulatory monitoring network. Regulatory monitoring stations are expensive and labor intensive.
New sensor technology with lower costs, less stringent quality assurance/quality control requirements, smaller footprint and ease of operations has the promise to fill in some of the data gaps in smaller communities as the technology improves. There is a need to expand particulate matter monitoring into underserved areas of the state that are areas impacted by frequent wildland fire smoke, seasonal or year-round road dust and wintertime inversions.
Throughout the State there are only a few communities with populations between 1,000 and 10,000. These communities are often hub communities, i.e. regional transportation hubs that are served by larger commercial airlines and are jumping off points to the smaller communities by smaller commercial airlines or private transport. Approximately one third of Alaska’s population lives in small rural communities of less than 1,000 residents.
11.1 Community Based Monitoring
Over the past couple of years, DEC has worked to expand the Community-Based Air Monitoring network, deploying LCS pods in rural and tribal communities across the state to collect baseline air quality data in communities that have been previously underserved. The expansion of this network has been possible with funding from the ARP and IRA grants, though these grants expire in 2026 and 2028, respectively. DEC hopes to maintain the network at its current size, dependent on sensor pod technology and lifespan, available funding, and staffing.
Smaller and cheaper sensor technology will be used to expand particulate matter monitoring for wildfire smoke strategically into smaller communities. This effort, started in 2019, was spearheaded by the University of Alaska Fairbanks, when approximately 30 PurpleAir sensors were set-up in rural areas all around the state. Due to the short lifespan of these low cost sensors (EPA estimates a life time of 1-3 years) keeping the sensor network functional and updated will be an ongoing commitment and could prove challenging.
As mentioned above, road dust is a major concern statewide. DEC will continue to follow low-cost sensor development and investigate and test low-cost sensor technology suitable for PM10 monitoring.
11.2 Source Specific Monitoring
11.2.1 Wildland Fire Smoke
DEC intends to continue building out the Community-Based Air Monitoring network to serve as a wildland fire smoke network. Many areas of Alaska do not have cellular coverage or cell service that is compatible with the current QuantAQ ModulairTM sensors. DEC is researching and testing Wi-Fi capable sensors that will be deployed into areas that are lacking cellular coverage to increase sensor coverage throughout the state.
11.2.2 Air Toxics Monitoring
The Fairbanks North Star Borough has been in non-attainment for PM2.5 since 2009. The main component in PM2.5 in this area is organic carbon and home heating from wood stoves is the dominant source. Wood smoke contains many toxic components, but DEC has not collected information about air toxics levels in the community and the area is a prime location for a National Air Toxics Trend site (NATTS).
The establishment of even one air toxics permanent sampling site is costly and time-consuming, with the financial costs typically exceeding the capital and operational funds normally available to DEC. However, DEC sought and received an IRA grant to fund the construction and operation of a NATTS site at the Hurst Road monitoring station with sampling scheduled to begin January of 2026 and operating for 3 years. DEC will use the data to inform the public of any identified health risks and compile a list of air toxics found in the airshed. The data will be reviewed and analyzed to determine the value seeking additional funding and continuing the project past 2029.
Another area that has consistently requested some air toxics sampling is the North Slope Borough. As oil and gas development expands to areas closer to communities, the public becomes more concerned about volatile organic compounds (VOC) and other air toxics. Short term studies on the North Slope, populated areas such as Anchorage, or remote communities like Nome may also provide useful data.
Additionally, DEC has discussed a cooperative effort with EPA to bring their new constructed mobile air toxics lab up to Alaska to provide additional air toxics measurements in the Fairbanks non-attainment area and also provide valuable data from wildfire smoke, background levels near Denali National Park, and areas of Anchorage that are impacted by higher populations and industrial uses.
11.2.3 Radiation Monitoring
There are three radiation monitoring network sites (RadNet) in Alaska, located in Anchorage, Fairbanks and Juneau. DEC Air Monitoring and Quality Assurance Program operates all three sites for EPA. Shortly after the 2011 Fukushima Dai-Ichi Nuclear Power Plant incident additional short term monitoring was set up in Nome, Unalaska/Dutch Harbor and Juneau. At the time the question was brought up whether the existing sites are intended as early warning stations or rather to document radiation levels experienced throughout the state. If early warning is the goal, the sites in Anchorage and Fairbanks are not the best locations to meet this objective. The sites should either be moved to the coast to allow for early detection and actions before the radiation reaches the population centers inland or additional coastal monitors should be installed to meet this need. Discussion is ongoing and no decision has been reached yet on changes to this network.
11.3 Other Considerations
Over the years, monitoring activities that do not specifically target a monitoring site or the community-based sensor network have been delayed or deferred. Dedicated funding and staff expertise are required for some of these activities, like building a wireless communication device or a specialized air sensor pod. Staff expertise is sometimes impacted by the best staff available at hand or employee turnover that prevents the necessary skill set from advancing and developing the project. The lack of stable fast internet connections or even widespread stable cell phone infrastructure makes data telemetry very expensive when using off-the-shelf solutions and often do not work well in Alaska’s isolated communities. Improvements in satellite communication are nearing viability but are not quite mainstream for all applications. Sensor pods that work in more moderate climatic conditions might not be suitable for Alaskan wintertime conditions, with temperatures not uncommonly dropping to -50F in interior or northern Alaska. Even hardier technologies may struggle at relatively common wintertime temperatures of -20F. Adaptations to our harsh climate are usually not available on a commercial scale and in-house development might be the best path forward. Developing Alaskan proof technology in-house is time consuming and requires the right skill set.
DEC has developed an internal system, AirTools, for the disseminations of air quality information and advisories via statewide delivery of email and text alerts for air quality advisories. The public can sign up for these alerts through a MyAlaska58 account. Alerts are also posted on DEC’s website59 and on various social media platforms, providing residents with multiple options to receive air quality information.
DEC is seeking equipment to develop a dedicated air quality standard lab. The program utilizes many traceable field standards to meet the high-level quality assurance and control necessary to operate a regulatory air quality monitoring program. These standards are used by field staff to validate the appropriate operation of instruments on a regular basis and to troubleshoot equipment that is broken, in need of maintenance, or due for calibration. Typically these standards are sent out for recertification at a vendor. This process can often take weeks to months, cost hundreds to thousands of dollars for each unit, and items may be lost or damaged in shipment. A standards lab would contain numerous lab grade primary standards that can be used to recertify the field standards. While costly, the benefits are enormous. It can save tens of thousands of dollars on recertification and shipping costs, prevent long shipping delays and wait times that impact site activities and staff operations. This also improves DEC’s ability to validate the status of equipment more regularly and improve quality assurance efforts.
12 Summary
Air monitoring is expensive, but even more so in Alaska, because of unique challenges including the state’s extreme climate, varied ecosystems, large size, limited road system, decentralized power grid, and limited and unstable phone and internet infrastructure. Due to these factors, air monitoring related travel and site maintenance costs are likely among the highest in the nation per capita served. In the past, Alaska’s situation was partially compensated through special consideration of these higher expenses in the federal funding allocations. In recent years federal and state funding has stagnated, resulting in an actual decrease of available funding over time due to increased personnel cost and inflation.
Despite DEC and EPA efforts, Alaska remains well behind the rest of the country in both the spatial coverage of its monitoring network and technical advancements for sampling automation and web-based data reporting. While DEC continuously strives to improve our monitoring capacity, current staffing and funding levels have not been supportive of the goal of narrowing the technological and data gap between the State and the nation.
During the next five years, we anticipate an increased public demand for real time data access via the internet, not just in Alaska’s growing communities like the Mat-Su Borough, or problem areas like the Fairbanks North Star Borough, but also from rural and tribal communities, which face many of the same issues as the metropolitan areas do. Public awareness of the effects of poor or compromised air quality is growing throughout the state.
To be responsive to public requests, DEC will need to look to low-cost sensors to expand monitoring in previously underserved areas. This might initially be spearheaded with low levels of funding and interagency cooperation. To build a stable statewide network, dedicated funding and staffing will be necessary. The fast-growing sector of new and cheaper monitoring technology that supports a ‘citizen scientist’ movement will require states to spend time communicating challenges of the new technology as performance is still an issue for a lot of low-cost technology.
Other data needs like expanded air toxics monitoring outside of the Fairbanks non-attainment area would require an extensive effort and funding. At this point with state budgets in recession, a new program like this would likely need to rely entirely on federal funding. Development of the standards lab would be a value-added improvement for the program but does require significant upfront costs for the long-term value it provides.
Footnotes
-
Data was obtained through the Bureau of Labor Statistics Consumer Price Index data. https://www.bls.gov/data/inflation_calculator.htm. ↩︎
-
https://dec.alaska.gov/Applications/Air/airtoolsweb/Advisories/ ↩︎
-
In areas designated non-attainment for the Pb standards prior to the promulgation of the current (2008) standards, and for which implementation plans to attain or maintain the current (2008) standards have not been submitted and approved, the previous standards (1.5 μg/m3 as a calendar quarter average) also remain in effect. ↩︎
-
The level of the annual NO2 standard is 0.053 ppm. It is shown here in terms of ppb for the purposes of clearer comparison to the 1-hour standard level. ↩︎
-
Final rule signed October 1, 2015, and effective December 28, 2015. The previous (2008) O3 standards additionally remain in effect in some areas. Revocation of the previous (2008) O3 standards and transitioning to the current (2015) standards will be addressed in the implementation rule for the current standards. ↩︎
-
On March 12, 2025, EPA issued a press release noting that they would reconsider the PM2.5 NAAQS implemented under the former administration. ↩︎
-
The previous SO2 standards (0.14 ppm 24-hour and 0.03 ppm annual) will additionally remain in effect in certain areas: (1) any area for which it is not yet 1 year since the effective date of designation under the current (2010) standards, and (2) any area for which implementation plans providing for attainment of the current (2010) standard have not been submitted and approved and which is designated non-attainment under the previous SO2 standards or is not meeting the requirements of a State Implementation Plan (SIP) call under the previous SO2 standards (40 CFR 50.4(3)). A SIP call is an EPA action requiring a state to resubmit all or part of its SIP to demonstrate attainment of the required NAAQS. ↩︎
-
The State of Alaska retained the previous SO2 NAAQS, even after 2010, when EPA rescinded the NAAQS for the 24-hour and annual averaging period and lowered the 3-hour averaging period from a primary to a secondary standard. ↩︎
-
https://www.aoga.org/wp-content/uploads/2024/04/MRG-Economic-Impacts-of-Oil-and-Gas-Report-Final-3.7.24.pdf https://usafacts.org/answers/what-is-the-gross-domestic-product-gdp/state/alaska/ ↩︎
-
https://cdn.prod.website-files.com/64ce12f622aae5b063ef1c45/66b1a0ed7378dc6c8db3e30e_McKinley%20economic-benefits-of-alaskas-mining-industry-may-2022.pdf ↩︎
-
https://www.alaskatia.org/resources/tourism-works-for-alaska ↩︎
-
https://www.alaskaseafood.org/wp-content/uploads/PSPA-Seafood-Impacts-One-Sheet-2025-FINAL_REV2.pdf ↩︎
-
https://bit.ly/4eJQT1q based on population estimates for July 1, 2023, obtained from the United States Census Bureau. ↩︎
-
Alaska Department of Labor & Workforce Development. Alaska Population Projections 2023 to 2050 (July 2024). Retrieved from https://live.laborstats.alaska.gov/pop/projections/pub/popproj.pdf ↩︎
-
http://live.laborstats.alaska.gov/pop/estimates/pub/18popover.pdf ↩︎
-
Temporal Requirements for Modeling Data Set Utilization, May 2024.↩︎
-
Road dust monitoring data for rural Alaska is limited. Results of existing monitoring suggest that most rural villages have a summer and early fall road dust problem. ↩︎
-
The proposed regulation would have eliminated the need to prepare a maintenance plan. Normally the submission of a maintenance plan to EPA is required before reclassification can be considered. ↩︎
-
2020 Eagle River 2nd 10-year PM-10 Limited Maintenance Plan https://dec.alaska.gov/media/23998/epa-r10-oar-2020-0648-11-09-21.pdf ↩︎
-
Amendments to State Air Quality Control Plan, Juneau’s 2nd 10-year PM-10 Limited Maintenance Plan ↩︎
-
2013 Fairbanks North Star Borough CO Limited Maintenance Plan, https://dec.alaska.gov/air/anpms/ ↩︎
-
2013 Anchorage Limited Maintenance Plan, https://dec.alaska.gov/air/anpms/ ↩︎
-
https://www.epa.gov/system/files/documents/2024-11/o3xs-implementation-memo_2024november12_final.pdf ↩︎
-
No lead monitoring is being conducted in the state. Source oriented monitoring was waived for Red Dog mine. A second waiver request has been submitted to EPA for approval. ↩︎
-
https://dec.alaska.gov/air/air-monitoring/guidance/monitoring-plans/ ↩︎
-
Design value data excludes exceptional events from calculations. ↩︎
-
The A Street site was opened in 2019 and therefore did not have 3-years’ worth of valid data in 2020 for a design value calculation. ↩︎
-
A Street did not meet data completeness criteria in 2021 that prevented a valid design value calculation for the site until 2024. ↩︎
-
Annual values did not meet data completeness criteria. This value is preliminary and subject to the maximum value substitution test as outlined in 40 CFR Part 50 Appendix N. ↩︎
-
The A Street site was opened in 2019 and therefore did not have 3-years’ worth of valid data in 2020 for a design value calculation. ↩︎
-
The A Street site was opened in 2019 and therefore did not have 3-years’ worth of valid data in 2020 for a design value calculation. ↩︎
-
PM2.5 monitoring discontinued at the Harrison Ct site in Butte in 2023 and monitoring began at the Plant Materials Center monitoring site in 2024, as such 24-hour 3-year design values cannot be validly calculated for marked years as there was not 3-years’ worth of data available for those years since the site was not yet open or was closed. ↩︎
-
Annual values did not meet data completeness criteria. This value is preliminary and subject to the maximum value substitution test as outlined in 40 CFR Part 50 Appendix N. ↩︎
-
Annual values did not meet data completeness criteria. This value is preliminary and subject to the maximum value substitution test as outlined in 40 CFR Part 50 Appendix N. ↩︎
-
The A Street site was opened in 2019 and therefore did not have 3-years’ worth of valid data in 2020 for a design value calculation. ↩︎
-
A Street did not meet data completeness criteria in 2021 that prevented a valid design value calculation for the site until 2024. ↩︎
-
Annual values did not meet data completeness criteria. This value is preliminary and subject to the maximum value substitution test as outlined in 40 CFR Part 50 Appendix N. ↩︎
-
The A Street site was opened in 2019 and therefore did not have 3-years’ worth of valid data in 2020 for a design value calculation. ↩︎
-
The A Street site was opened in 2019 and therefore did not have 3-years’ worth of valid data in 2020 for a design value calculation. ↩︎
-
PM2.5 monitoring discontinued at the Harrison Ct site in Butte in 2023 and monitoring began at the Plant Materials Center monitoring site in 2024, as such 24-hour 3-year design values cannot be validly calculated for marked years as there was not 3-years’ worth of data available for those years since the site was not yet open or was closed. ↩︎
-
Annual values did not meet data completeness criteria. This value is preliminary and subject to the maximum value substitution test as outlined in 40 CFR Part 50 Appendix N. ↩︎
-
Data excludes exceptional events from calculations. ↩︎
-
Annual values did not meet data completeness criteria. This value is preliminary and subject to the maximum value substitution test as outlined in 40 CFR Part 50 Appendix N. ↩︎
-
https://dec.alaska.gov/air/anpms/communities/fbks-pm2-5-fuel-switch-requirement/ ↩︎
-
SO2 monitoring did not begin at Hurst Road until 2022 and was not monitored to data completeness standards in 2022 and 2024, as such 24-hour 3-year design values cannot be validly calculated for marked years as there was not 3-years’ worth of complete data available for those years. ↩︎
-
Annual values did not meet data completeness criteria. This value is preliminary and subject to the maximum value substitution test as outlined in 40 CFR Part 50 Appendix N. ↩︎
-
SO2 monitoring did not begin at Hurst Road until 2022 and was not monitored to data completeness standards in 2022 and 2024, as such 24-hour 3-year design values cannot be validly calculated for marked years as there was not 3-years’ worth of complete data available for those years. ↩︎
-
SO2 monitoring did not begin at Hurst Road until 2022 and was not monitored to data completeness standards in 2022 and 2024, as such 24-hour 3-year design values cannot be validly calculated for marked years as there was not 3-years’ worth of complete data available for those years. ↩︎
-
https://dec.alaska.gov/air/air-monitoring/guidance/monitoring-plans/↩︎
-
https://dec.alaska.gov/air/air-monitoring/responsibilities/database-management/alaska-air-quality-real-time-data/ ↩︎
-
https://dec.alaska.gov/Applications/Air/airtoolsweb/Advisories/ ↩︎
 Indicates an external site.