North Pole Refinery Maps
Updated: November 7, 2024
Notes
- A dashed or solid line generally outlines the approximate extent of the plume.
- On any given map, the most recent results are shown, however not all wells are/were sampled each quarter. Units are in µg/L or micrograms per liter; one µg/L = one part per billion or ppb.
- Maps are from the 3rd quarter unless otherwise indicated. The 3rd quarter sample event is generally the most comprehensive.
Most Recent Maps Offsite (the plume area)

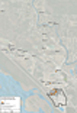
2017-2023: North Pole municipal water supply lines and sulfolane plume
From Williams Petroleum Alaska (Williams’) work plan to evaluate properties near the former refinery for possible alternative water supplies. (Figure 2)
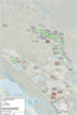
2023 PFAS monitoring results from Williams’ 2023 report on sampling PFOA and PFOS in groundwater and surface water (1.9M)
Figure 3 from the report.
2022: Sulfolane monitoring results from Williams' 2022 Annual Monitoring and Five-year (2017-2021) Offsite Plume Monitoring Report
Figures 7-10 of the report
Most Recent Maps onsite - former refinery property
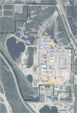
2023 Onsite groundwater monitoring results for sulfolane at water table and for benzene (includes 2 maps) (2.8M)
From Arcadis’ Annual 2023 Groundwater Monitoring report, for Flint Hills Resources, Figures 3-7 and 3-8
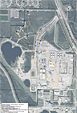
2023 Onsite sulfolane concentrations in groundwater at 10-55 ft and 55-90 ft on the former refinery property (includes 2 maps) (2.1M)
From Arcadis’ Annual 2023 Groundwater Monitoring report, for Flint Hills Resources, Figures 3-9 and 3-10
2022 Onsite PFAS soil sampling, and surface water and groundwater monitoring results (includes 5 maps) (3.3M)
From Integral Consulting's 2023 monitoring report for Williams, Figures 5 through 9
Earlier Maps
Maps Primarily Showing Conditions off the Refinery Property (plume area)
| Year | Map Desc/Download | Resource | File type/size |
|---|---|---|---|
| 2021 |
2021: Results of monitoring well testing for sulfolane in the plume (2.2M) Includes two maps: one with results of testing below permafrost and the mixing zone (Figure 7), the other above permafrost. (Figure 8) |
From Williams’ Annual 2021 Offsite Plume Monitoring Report. | PDF 2.2MB |
| 2020 |
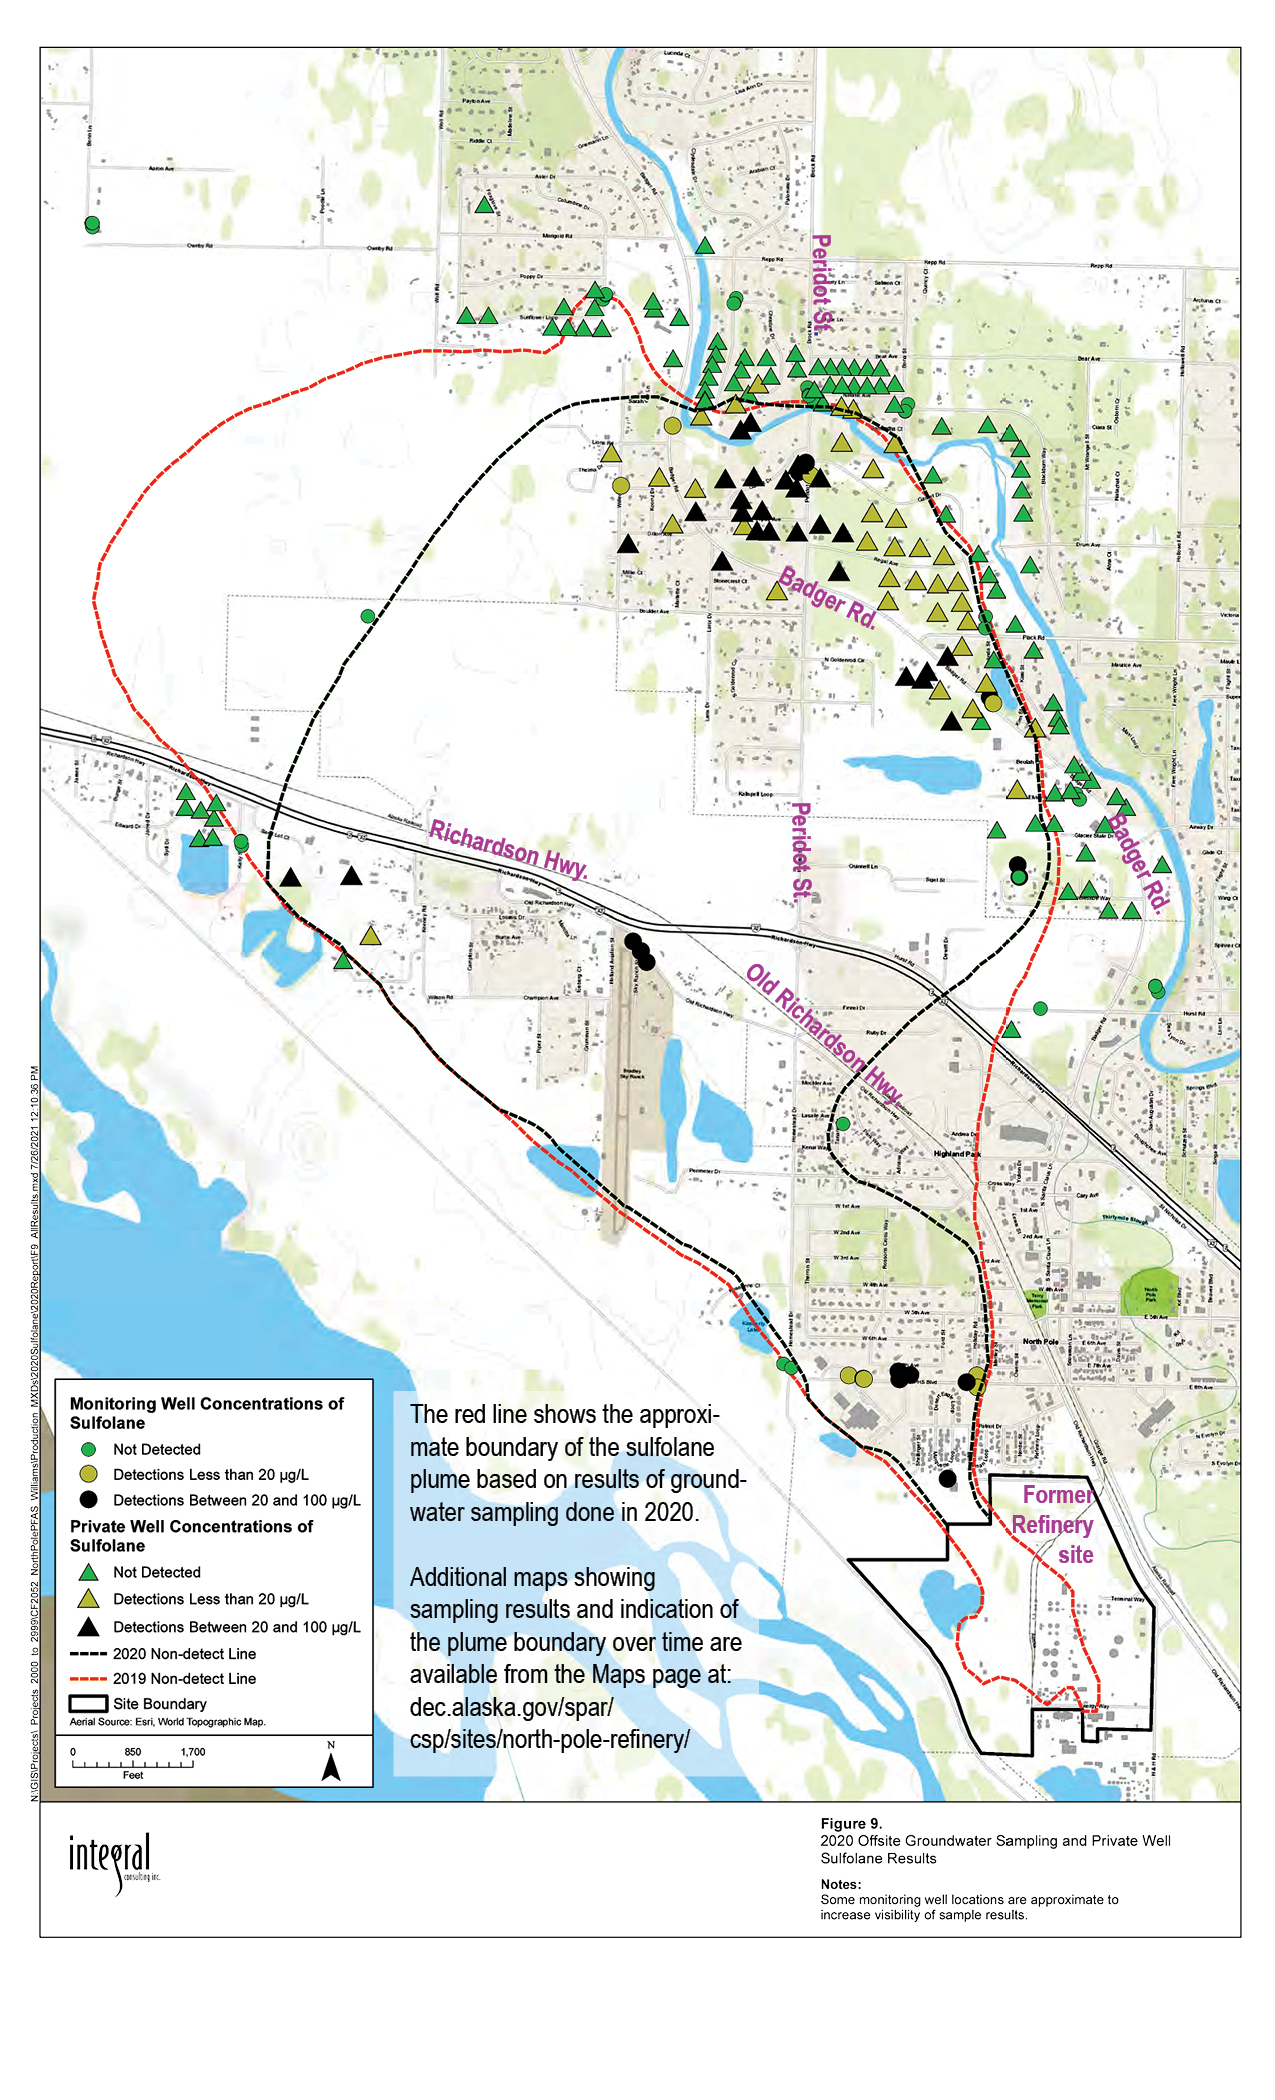
2020: Sampling results for Sulfolane in Private Wells and Off the Refinery Property |
From Williams’ Annual 2020 Offsite Plume Monitoring Report. (Figure 9) | PDF 1.4MB |
| 2019 |
2019: Annual 2019 Approximate Extent of Sulfolane Impacts (PDF) |
From Flint Hills’ Annual 2019 Offsite Plume Monitoring Report. (Figure 3-1) | PDF 788K |
| 2019 |
Annual 2019 Approximate Extent of Sulfolane Impacts, Private Well Sulfolane results (PDF 2.1M) |
From Flint Hills’ Annual 2019 Offsite Plume Monitoring Report. (Figure A-2) | PDF 2.1M |
| 2018 |
2018: North Pole Water Water System Expansion Project (1.3M) February 2018 |
Showing the plume area based on monitoring in 2017 and the current construction zones for water service expansion. | PDF 788K |
| 2018 | Flint Hills’ Annual 2017 Offsite Groundwater Monitoring Report | PDF 788K | |
| 2018 | Flint Hills' Annual 2017 Offsite Groundwater Monitoring Report | PDF 788K | |
| 2018 |
2018: offsite PFOS and PFOA plume map December 2019 |
Ahtna Engineering, 2018 Offsite PFAS Monitoring Report | PDF 506K |
| 2017 | Flint Hills' Annual 2017 Offsite Groundwater Monitoring Report, Figure 3-5) | PDF 788K | |
| 2017 | Flint Hills' Annual 2017 Offsite Groundwater Monitoring Report, Figure A-2) | PDF 788K | |
| 2016 |
2016 Potable Water Solutions Provided by Flint Hills Resources |
Flint Hills' Alternative Water Solutions Program 2016 Report | PDF 822K |
| 2016 | Second Semiannual 2016 Offsite Groundwater Monitoring Report (Figure 3-5) | PDF 788K | |
| 2016 |
2016 3rd Quarter: Offsite Sulfolane Trends, Monitoring Wells and Private Wells (PDF 741K) |
Second Semiannual 2016 Offsite Groundwater Monitoring Report (Figure 1-A) | PDF 741K |
| 2015 | Approximate extent of sulfolane impacts in offsite monitoring wells and private wells, 3rd Quarter | Second Semiannual 2015 Offsite Groundwater Monitoring Report (Figure 4-9) | PDF 821K |
| 2015 | Private well sulfolane results, 3rd Quarter | Second Semiannual 2015 Offsite Groundwater Monitoring Report (Figure 3-1) | PDF 676K |
| 2015 | Offsite sulfolane trends, monitoring wells and private wells,3rd Quarter | Second Semiannual 2015 Offsite Groundwater Monitoring Report (Figure 1-A) | PDF 741K |
| 2014 | Private well search areas and sulfolane results -Sulfolane concentrations in private wells | Third Quarter 2014 Monitoring Report (Figure 3-1) | PDF 705K |
| 2013 | Trends in sulfolane concentrations (increasing, decreasing, or stable) in private wells and monitoring wells | Third Quarter 2013 Groundwater Monitoring Report | PDF 764K |
| 2013 | Private Well Search Areas and Sulfolane Results -Sulfolane concentrations in private wells | Third Quarter 2013 Groundwater Monitoring Report (Figure 3-1) | PDF 715K |
| 2013 | Sulfolane concentrations - 10-55 feet below water table | Third Quarter 2013 Groundwater Monitoring Report (Figure 4-11) | PDF 715K |
| 2012 | Sulfolane concentrations at the water table | Fourth Quarter 2012 Monitoring Report (Figure 4-13) | PDF 630K |
| 2011 | Sulfolane concentrations in groundwater for select monitoring wells - 10-55 feet below the water table, 4th Quarter | Map created by DEC as an Open House display | PDF 1.4M |
| 2011 | Sulfolane concentrations in groundwater for select monitoring wells - at the Water Table, 4th Quarter | Map created by DEC as an Open House display | PDF 1.4M |
| 2011 | Sulfolane Concentrations in Off-Refinery Monitoring Wells (November 2010 through January 2011), First Quarter | Map created by DEC | PDF 2.5M |
| 2010 | Area of concern with monitoring data - April 14, 2010 | Map created by DEC | PDF 1.8M |
| 2009 | December Sample Results - Delineation wells. Samples were analyzed by two different laboratories, SGS and Pace | Shannon & Wilson, Fig. 1-A | PDF 170K |
| 2009 | Monitoring wells from the Ford subdivision - Nov. 24, 2009. Additional Monitoring wells, proposed for DEC approval, are marked in yellow. | Flint Hills Resources | PDF 568K |
Maps Primarily Showing Conditions on the Former Refinery Property
| Year | Map Desc/Download | Resource | File type/size |
|---|---|---|---|
| 2022 | 2022 Sulfolane Concentrations on the Former Refinery Property, water table depth | Flint Hills' Annual 2022 Onsite Groundwater Monitoring Report. (Figure 3-16) | 2M |
| 2022 | 2022 Sulfolane Concentrations on the Former Refinery Property, 10-55 feet depth | Flint Hills' Annual 2022 Onsite Groundwater Monitoring Report. (Figure 3-17) | 2M |
| 2022 | 2022 Benzene Concentrations on the Former Refinery Property | Flint Hills' Annual 2022 Onsite Groundwater Monitoring Report. (Figure 3-12) | 1.7M |
| 2021 | 2021 Sulfolane Concentrations on the Former Refinery Property | Flint Hills' Annual 2021 Onsite Groundwater Monitoring Report. (Figure 3-16) | 732K |
| 2021 | 2021 Benzene Concentrations on the Former Refinery Property | Flint Hills’ Annual 2021 Onsite Monitoring Report. (Figure 3-12) | 726K |
| 2021 | 2021 PFAS Concentrations on the Former Refinery Property | December 2020 Ground Water Sampling - combined PFOA+PFOS Results. From Williams’ Site Characterization Report. (Figure 10) | 1.3M |
| 2020 | 2020 Sulfolane Concentrations on the Former Refinery Property | Flint Hills' Second Semiannual 2020 Onsite Groundwater Monitoring Report. (Figure 3-16) | PDF 728K |
| 2020 | 2020 Benzene Concentrations on the Former Refinery Property | Flint Hills' Annual 2020 Onsite Groundwater Monitoring Report. (Figure 3-12) | PDF 719K |
| 2019 |
2019 Sulfolane Concentrations on the Former Refinery Property (PDF 572K) |
Flint Hills' Second Semiannual 2019 Onsite Groundwater Monitoring Report (Figure 3-16) | PDF 572K |
| 2019 |
2019 Benzene Concentrations on the Former Refinery Property (PDF 601K) |
Flint Hills' Second Semiannual 2019 Onsite Groundwater Monitoring Report. (Figure 3-12) | PDF 601K |
| 2017 |
2017 1st Quarter Sulfolane Concentrations on the Former Refinery Property (PDF 572K) |
Flint Hills' First Semiannual 2017 Onsite Groundwater Monitoring Report (Figure 3-9) | PDF 572K |
| 2017 |
2017 1st Quarter Benzene Concentrations on the Former Refinery Property |
Flint Hills' First Semiannual 2017 Onsite Groundwater Monitoring Report (Figure 3-8) | PDF 601K |
| 2016 |
2016 3rd Quarter Sulfolane Concentrations on the Former Refinery Property (PDF 1.2M) |
Flint Hills' Second Semiannual 2016 Onsite Groundwater Monitoring Report (Figure 3-10) | PDF 1.2M |
| 2016 |
2016 3rd Quarter Benzene Concentrations on the Former Refinery Property (PDF 678K) |
Flint Hills' Second Semiannual 2016 Onsite Groundwater Monitoring Report (Figure 3-9) | PDF 678K |
| 2015 | Sulfolane Concentrations on the former Refinery Property, 3rd Quarter | Flint Hills' Second Semiannual 2015 Onsite Groundwater Monitoring Report (figure 4-14) | PDF 706K |
| 2015 | Benzene Concentrations on the former Refinery Property, 3rd Quarter | Flint Hills' Second Semiannual 2015 Onsite Groundwater Monitoring Report (figure 4-13) | PDF 797K |
| 2012 | Benzene concentrations in groundwater monitoring wells on the refinery property | 4th Quarter 2012 Groundwater Monitoring Report (Figure 4-9) | PDF 530K |
| 2011 | Sulfolane Concentrations in On-Refinery Monitoring Wells (November 2010 through January 2011) | Map created by DEC | PDF 4.7M |
More Information
More analytical maps and data are available at the DEC office in Fairbanks:
- DEC Contaminated Sites Program
- 610 University Ave.
- Fairbanks, AK 99709-3643
- Main phone: 907-451-2143
- Fax: 907-451-5105
Division Address
- Department of Environmental Conservation
- Division of Spill Prevention and Response
- 410 Willoughby Ave., Ste. 302
- PO Box 111800
- Juneau, AK 99811-1800
 Indicates an external site.